Indicator
breakout
"session indicator" logo
session indicator
0.0
03/09/2025
3
Desktop

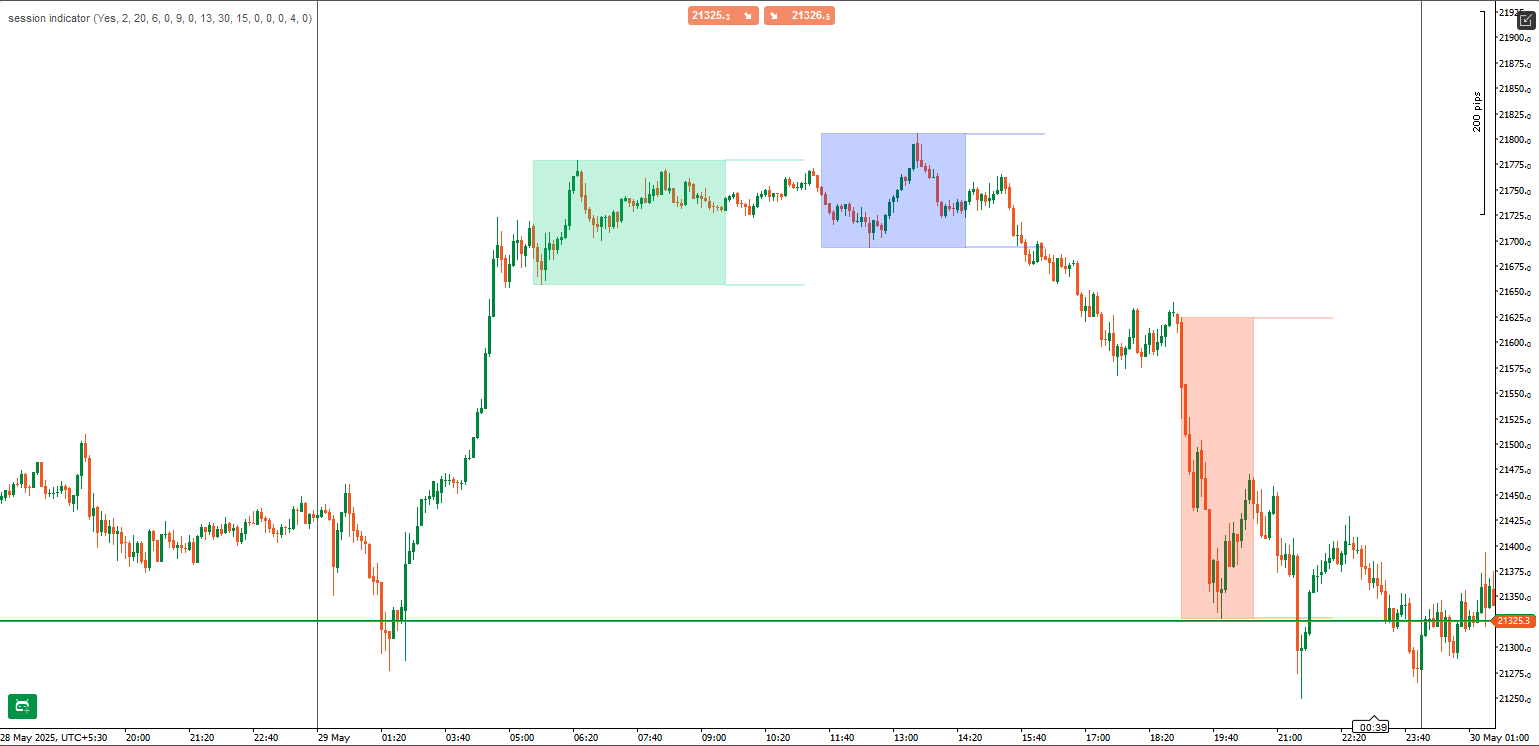
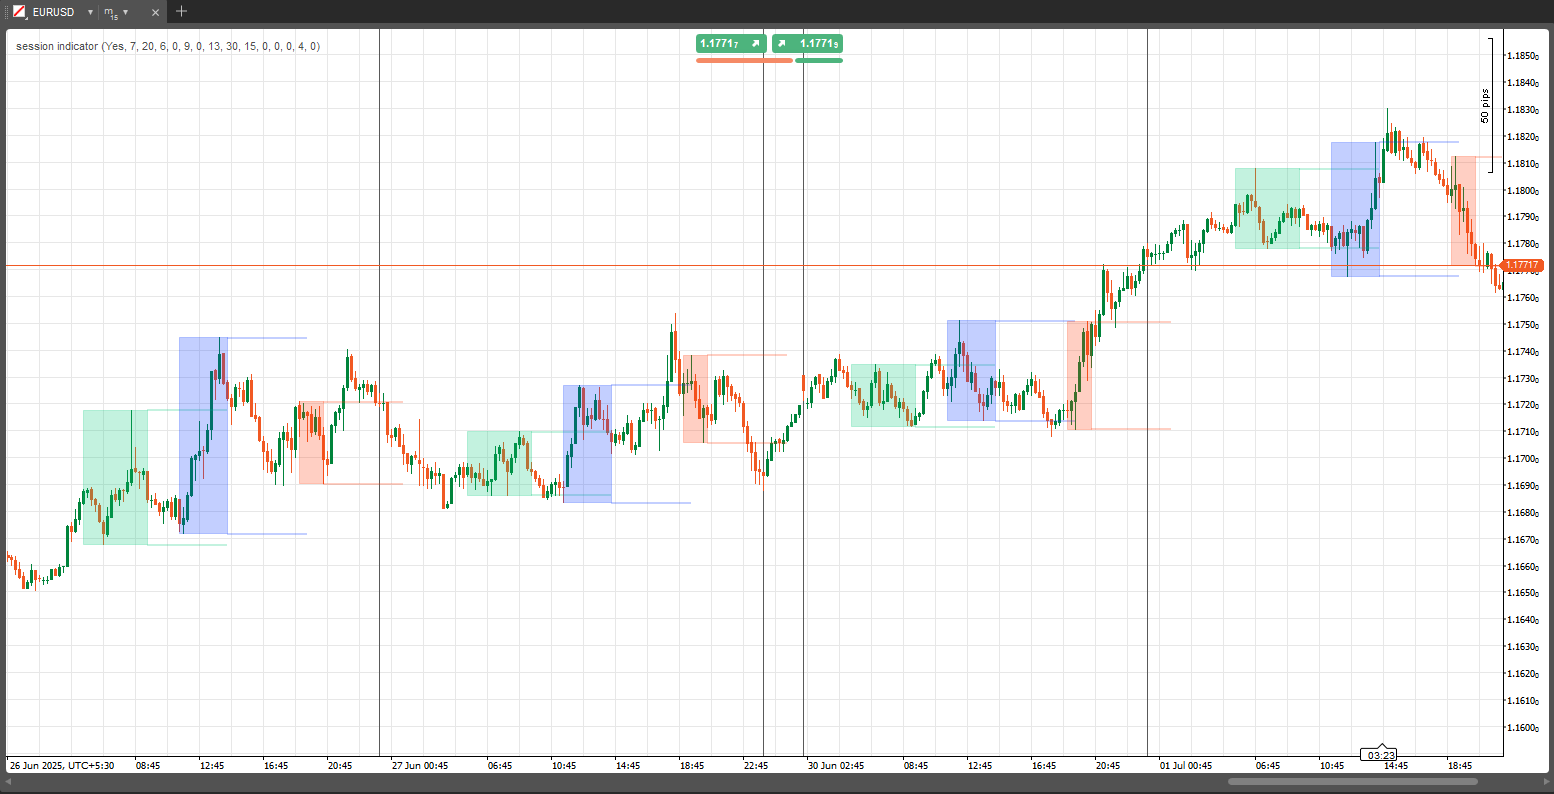
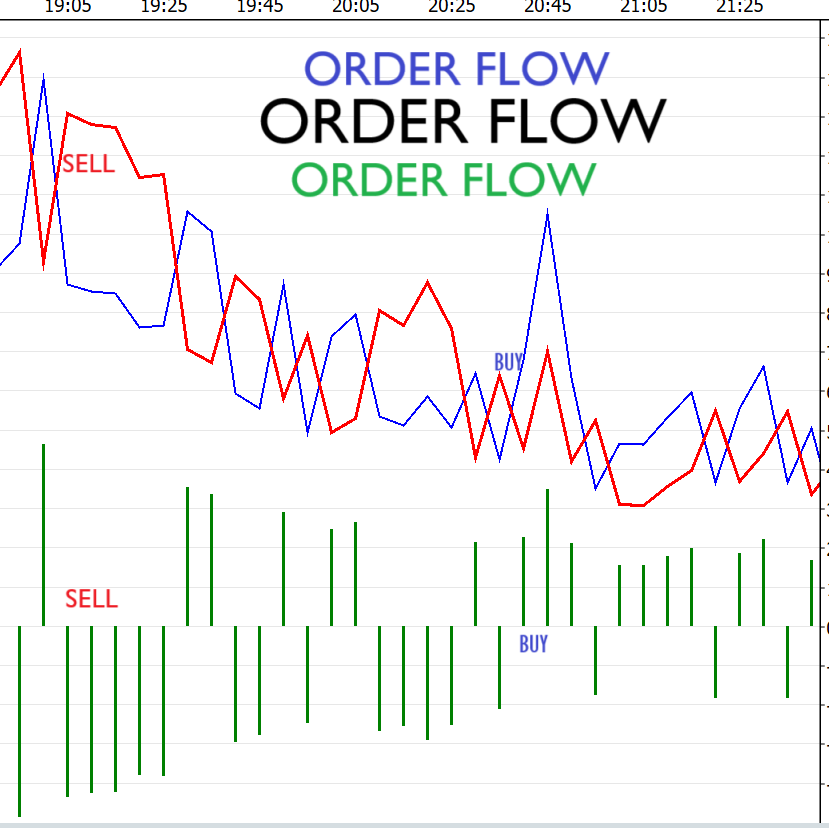
Visualize Key Market Sessions + High/Low Levels with Precision

The Trading Sessions Indicator highlights the most important trading sessions — London, New York, and Tokyo — directly on your chart. Whether you're a scalper or swing trader, knowing when volatility spikes or fades is crucial. This tool provides that edge with clarity.


✅ Key Features:

  • Session Rectangles: Visually highlight each session with optional shaded boxes
  • High/Low Lines: Plot session highs and lows with customizable extension length
  • Historical View: View session data for the current day or any number of previous days
  • Fully Customizable: Set session start/end times, toggle rectangles on/off, and define how far lines extend
  • Multiple Timeframe Support: Works on all chart timeframes
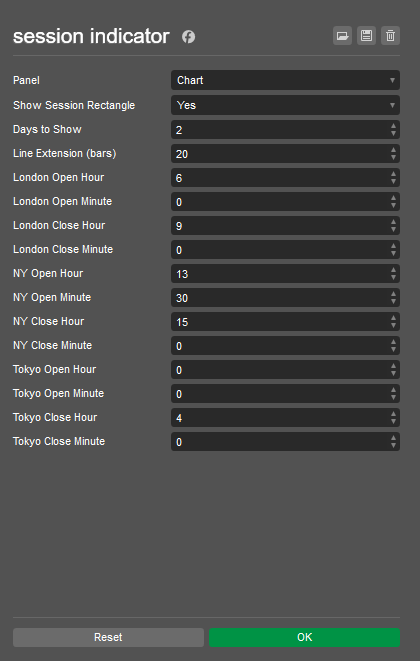

🔧 Parameters:

  • Session Times: Custom start/end time for London, NY, and Tokyo
  • Show Rectangle: Toggle shaded session boxes
  • Days to Show: Number of historical days to display session data
  • Line Extension Bars: Control how far session high/low lines extend on the chart


🧠 Why Use It?

Understanding session-based volatility patterns is a cornerstone of institutional trading. This indicator helps you:

  • Time entries and exits around key liquidity zones
  • Identify session highs and lows for breakout or reversal strategies
  • Visually separate session overlaps (e.g., London–NY)
More from this author
Indicator
supertrend
atr
supertrend
Supertrend Indicator for cTrader
support and resistance
Support and Resistance Line Indicator with Higher Timeframe Filter
Pivot Point Daily Indicator
Pivot Points Standard — All-in-One Multi-Timeframe Pivot Indicator for cTrader
You may also like
Indicator
bollinger
E7 Indicators Free Studies
ADXR, KDJ, SineWave, Bollinger Band Volatility and AEOscillator.
RT MACD
Customize the MACD! Choose colors, get real-time tick updates, and see crossover points for enhanced trading precision.
Indicator
signal
Half Trend BT
Half Trend BT by BullittTraders
Indicator
signal
IM_AngleIndicator
Indicator that calculates the slope of a moving average (SMA) and displays the value of the slope in degrees
Commodity Channel Index Smoothed w Alerts_NSC
Smoothed CCI alerts! Audio & arrow signals for +/-100 crosses. Custom sounds & arrow filters. Precision trading!
Morning Star On Chart
Morning Star pattern on chart (Bullish and Bearish) automatically marked with (BUY & SELL) Very powerful signals.
Multi_TF Candlestick Chart Overlay
Perfect for traders who demand a clear overview of multiple timeframes at a glance.
Indicator
scalping
Cross EMA Pro
Cross EMA Pro – Trend Reversal Indicator
DynamicVolumeSupplyDemand
Supply and Demand Zones
Decision Point
Decision Point
iqfx1
سيد قيصر ال مجيد
IR Coral
Coral indicator
Indicator
forex
crypto
stocks
Quantum Weighted Moving Average (QWMA)
Quantum Weighted Moving Average (QWMA): an advanced moving average that dynamically adjusts weights to market movement
Cumulative Delta Candles + VolumeProfile
Cumulative delta candles + volume profile
Indicator
forex
breakout
prop
+1
JPY Samurai Breakout Pro
⚔️ JPY Samurai Breakout Pro — Professional Breakout Indicator for cTrader ⚔️
IR Moving Average
 this moving include everything that a trader needs from Moving Average.
Indicator
breakout
btcusd
supertrend
+4
Multi-Level Candle Bias Tracker
Price direction by calculating the probability of reaching new highs/lows. Shows levels & stats📈
Fury Team E_M_A_su_TF
EMA ON TF (MULTI-TIMEFRAME)