Get cTrader
Start trading
cBots
Indicators
Plugins
Brokers & Props
Indicator
MACD
IR Macd on Chart
Share
5.0
03/09/2025
277
Desktop
IRCtrader
Since 23/01/2025
Free installs
3219
Description
Customer reviews
this indicator show macd on chart.
Expand
More from this author
Top-rated
IR Candle MTF
IRCtrader
4.6
(5)
Free
Indicator
IR Candle MTF
with this indicator you could see other time frame candle in your chart.
Free
IR Spread
IRCtrader
Free
Indicator
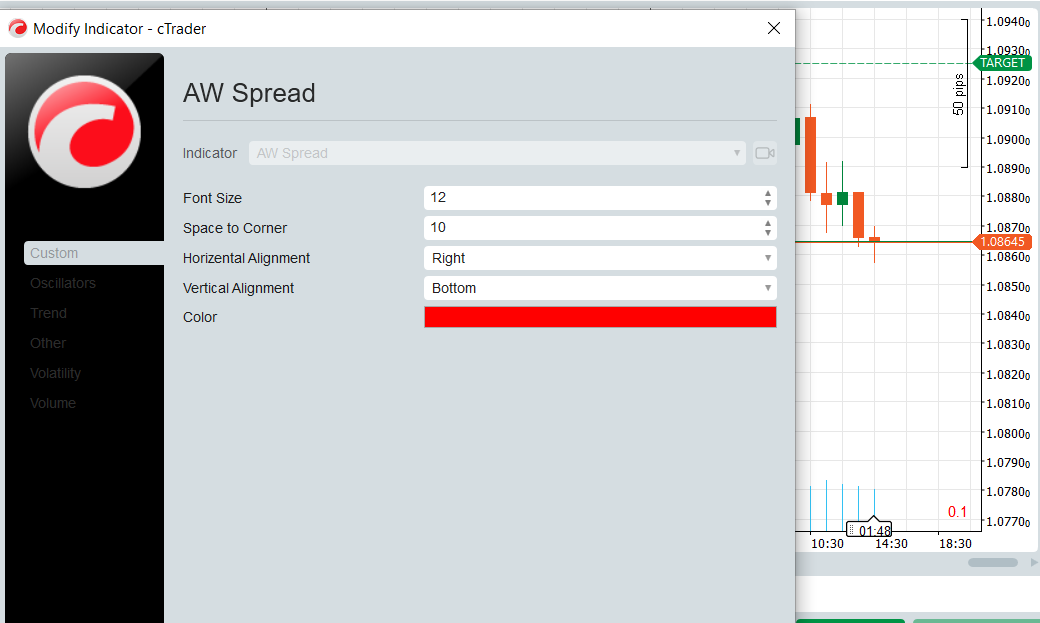
IR Spread
show spread on chart
Free
Top-rated
IR Macd + MacdLine
IRCtrader
5.0
(2)
Free
Indicator
MACD
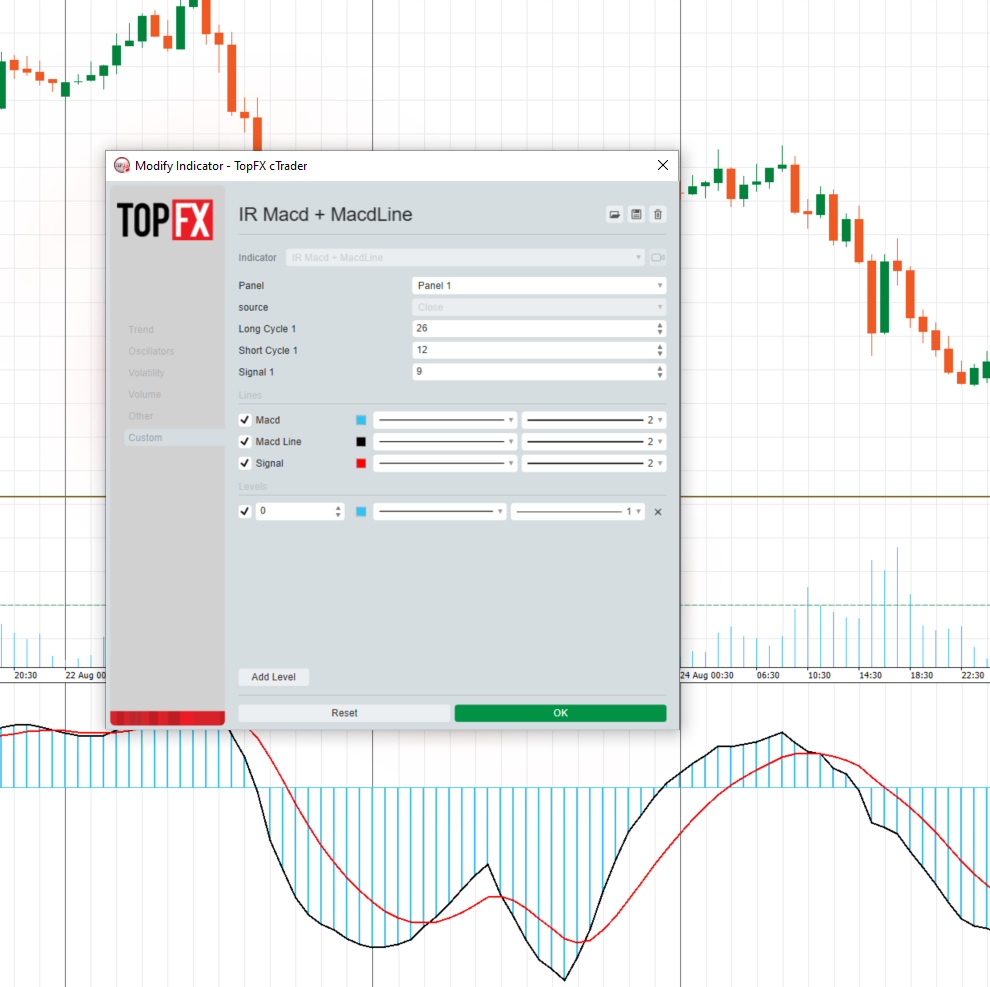
IR Macd + MacdLine
some user add moving average to macd to see better. in ctrader 4.3.11 there is a problem with this . I make a macd tha
Free
IR Moving Average
IRCtrader
5.0
(1)
Free
Indicator
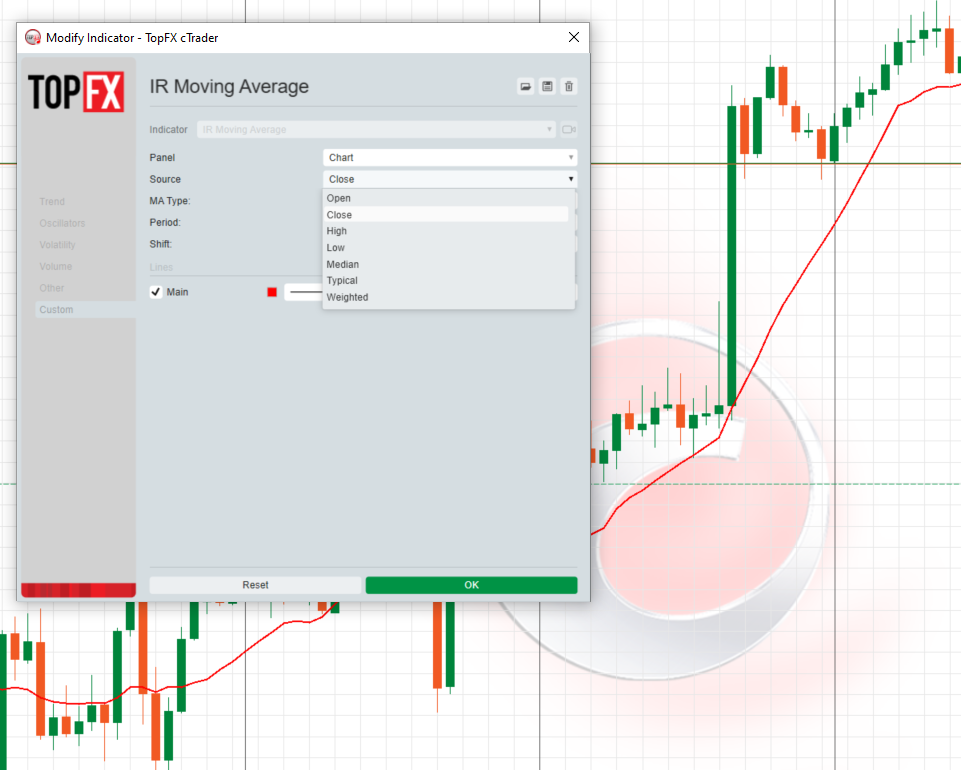
IR Moving Average
this moving include everything that a trader needs from Moving Average.
Free
IR Ichimoku Macd
IRCtrader
5.0
(1)
Free
Indicator
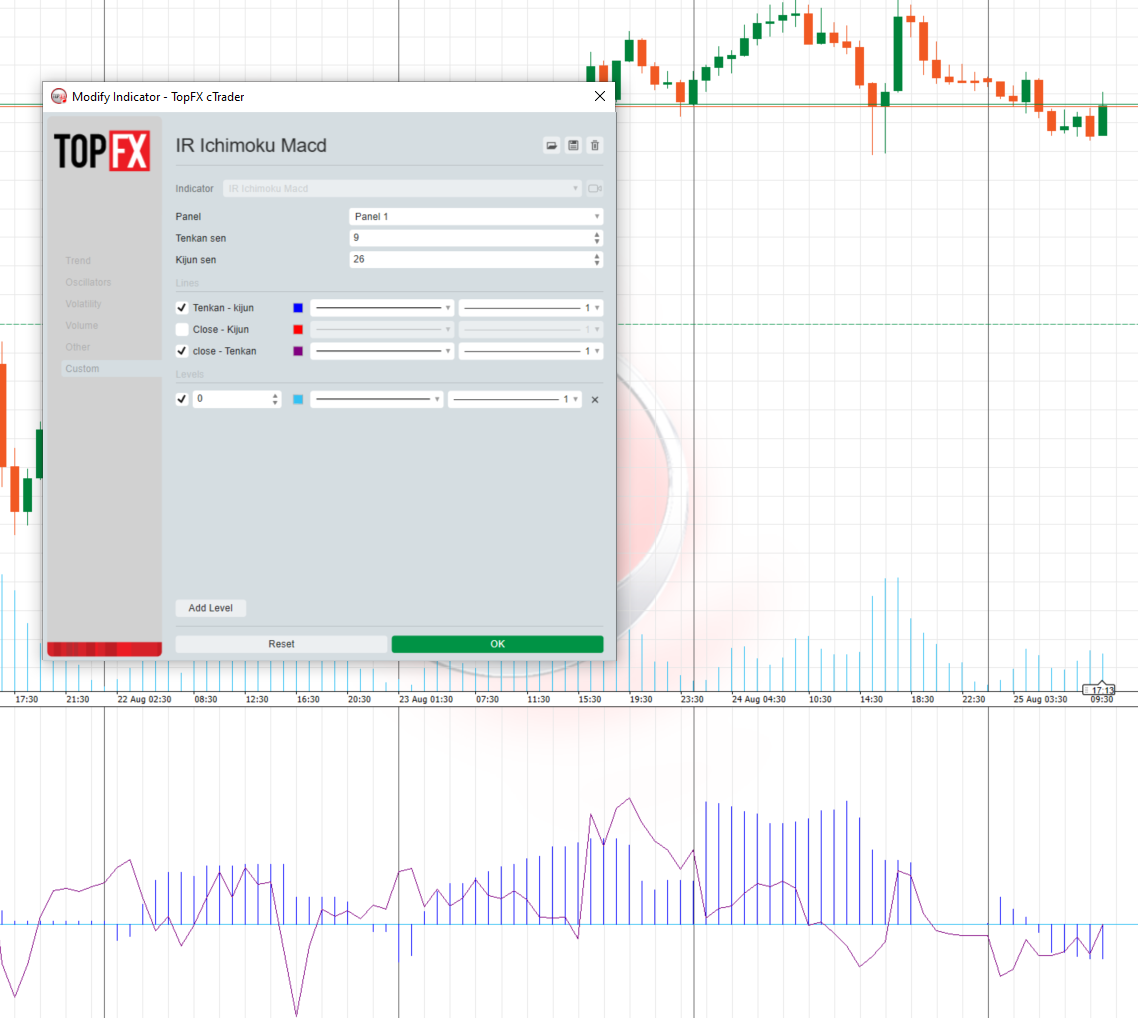
IR Ichimoku Macd
this indicaotr show distance between Tenkan to Kijun, Close to Kijun and Close to Tenkan
Free
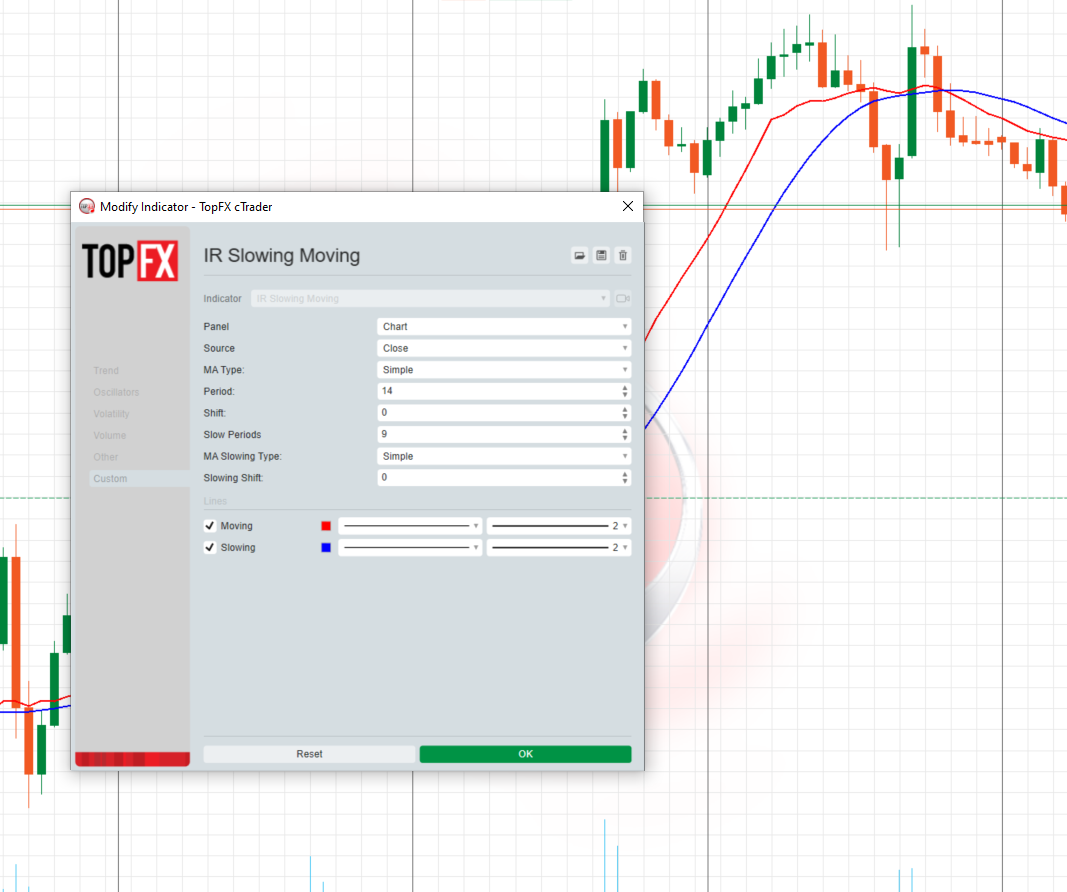
IR Slowing Moving
IRCtrader
5.0
(1)
Free
Indicator
IR Slowing Moving
Add Slowing to IR Moving Average.
Free
IR CheckList
IRCtrader
Free
Indicator
IR CheckList
you could put your check list in your chart you could split your test with “,” you could put your checklist in indicat
Free
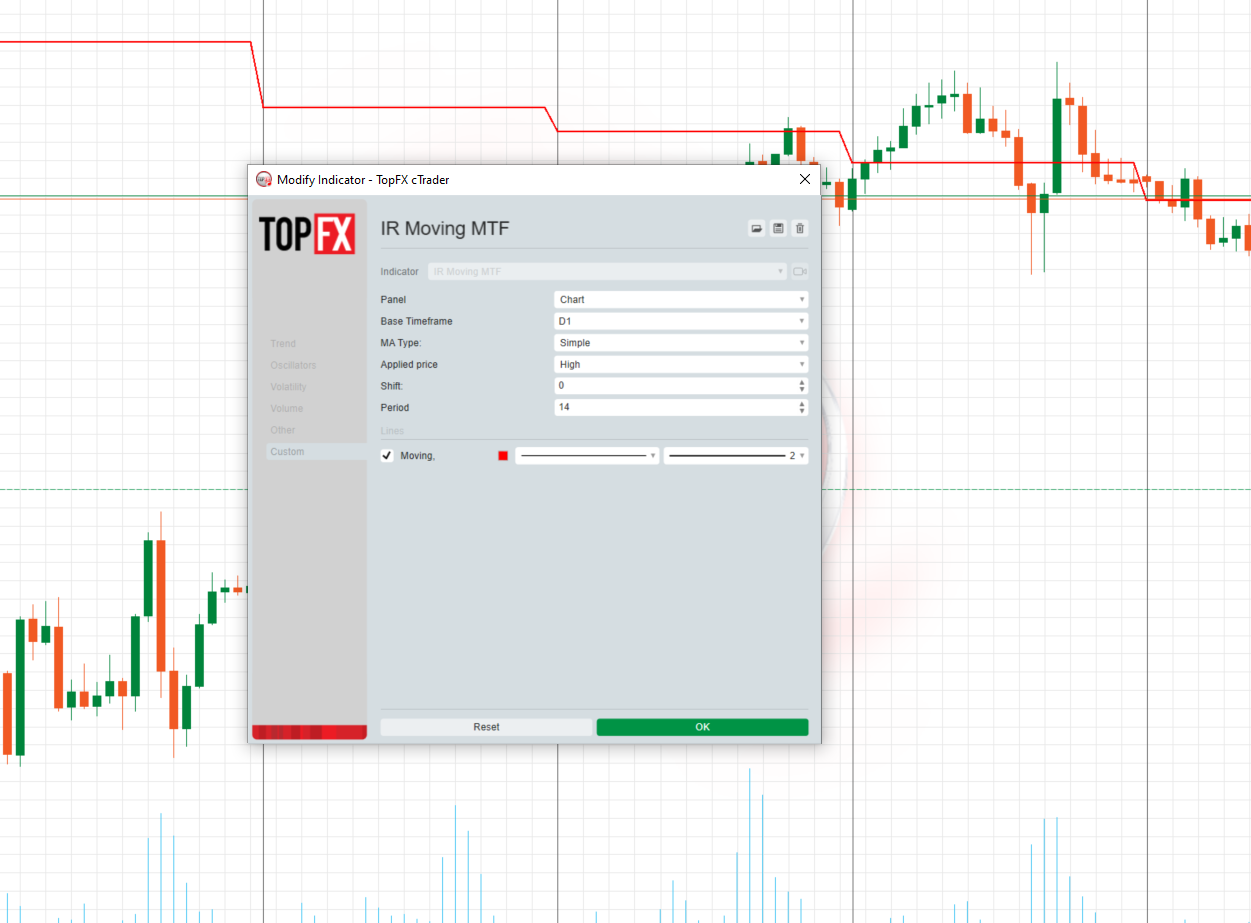
IR Moving MTF
IRCtrader
Free
Indicator
IR Moving MTF
multi time frame moving averge. you could choose different type of price like median ,high and ... and differnt type of
Free
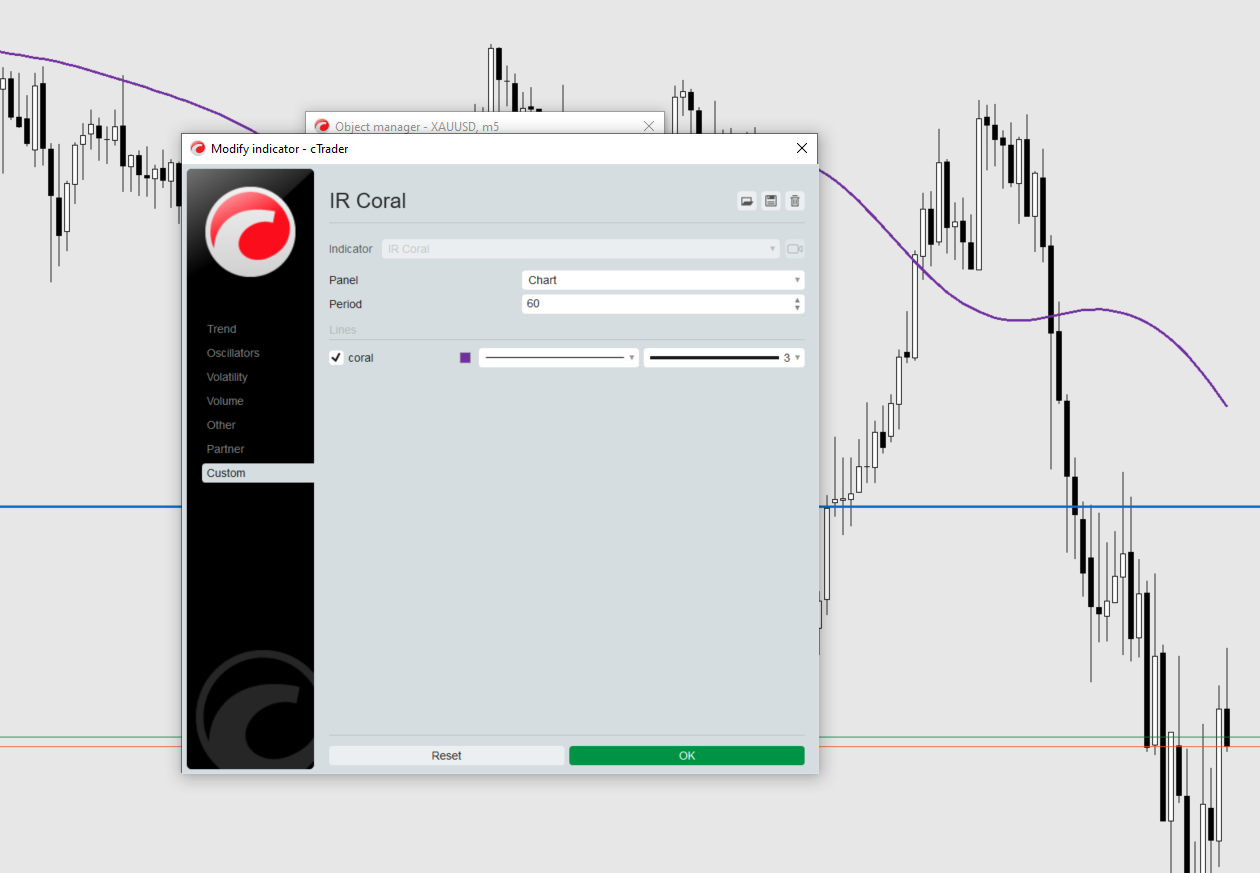
IR Coral
IRCtrader
5.0
(1)
Free
Indicator
IR Coral
Coral indicator
Free
IR VLine
IRCtrader
5.0
(1)
Free
Indicator
IR VLine
don't move to the end of chart after timeframe changing. it should be better to use for near history. for long history
Free
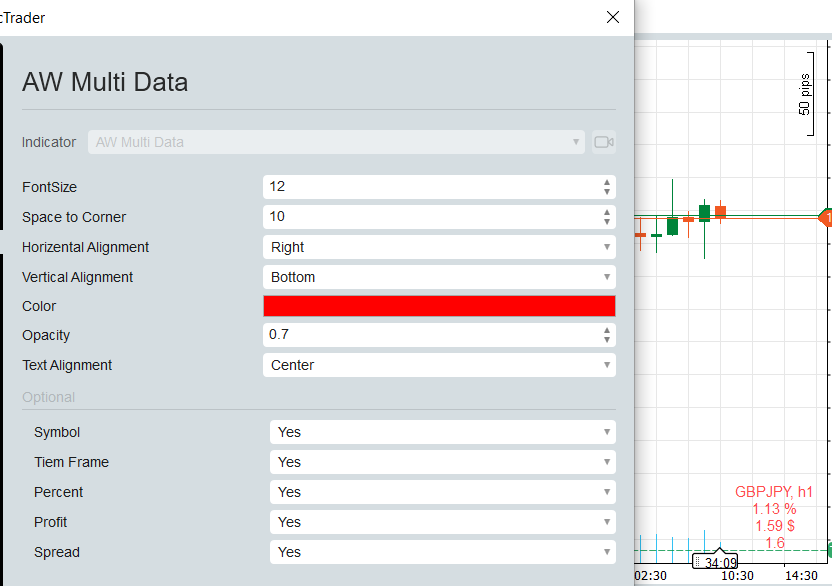
IR Multi Data
IRCtrader
5.0
(1)
Free
Indicator
IR Multi Data
show symbol and time fram, daily net profit percent, daily net profit, and spread ln your chart. consider that timezone
Free
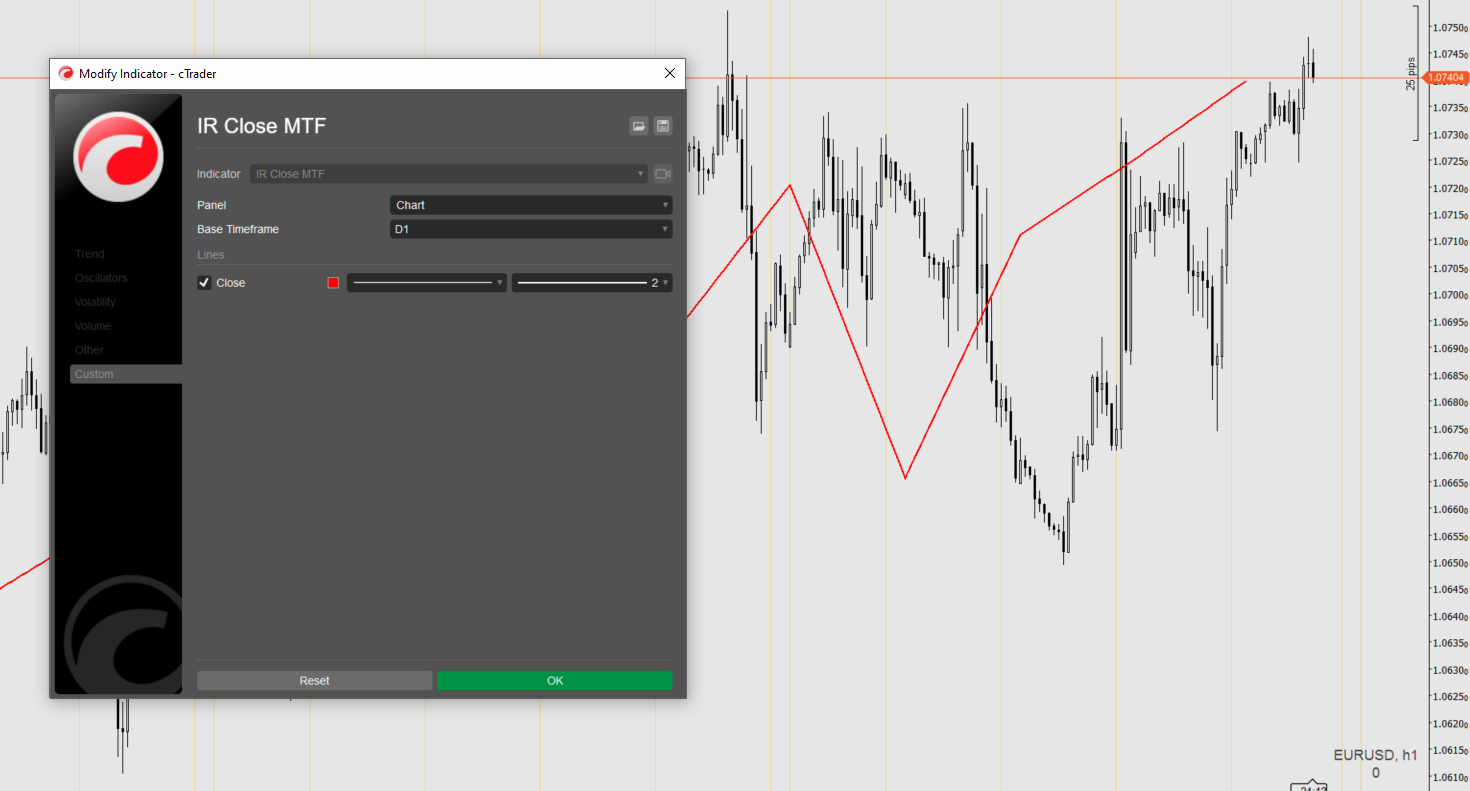
IR Close MTF
IRCtrader
5.0
(1)
Free
Indicator
IR Close MTF
this indicator show other time frame close in lower time frame. for ex: show daily close in m 15.
Free
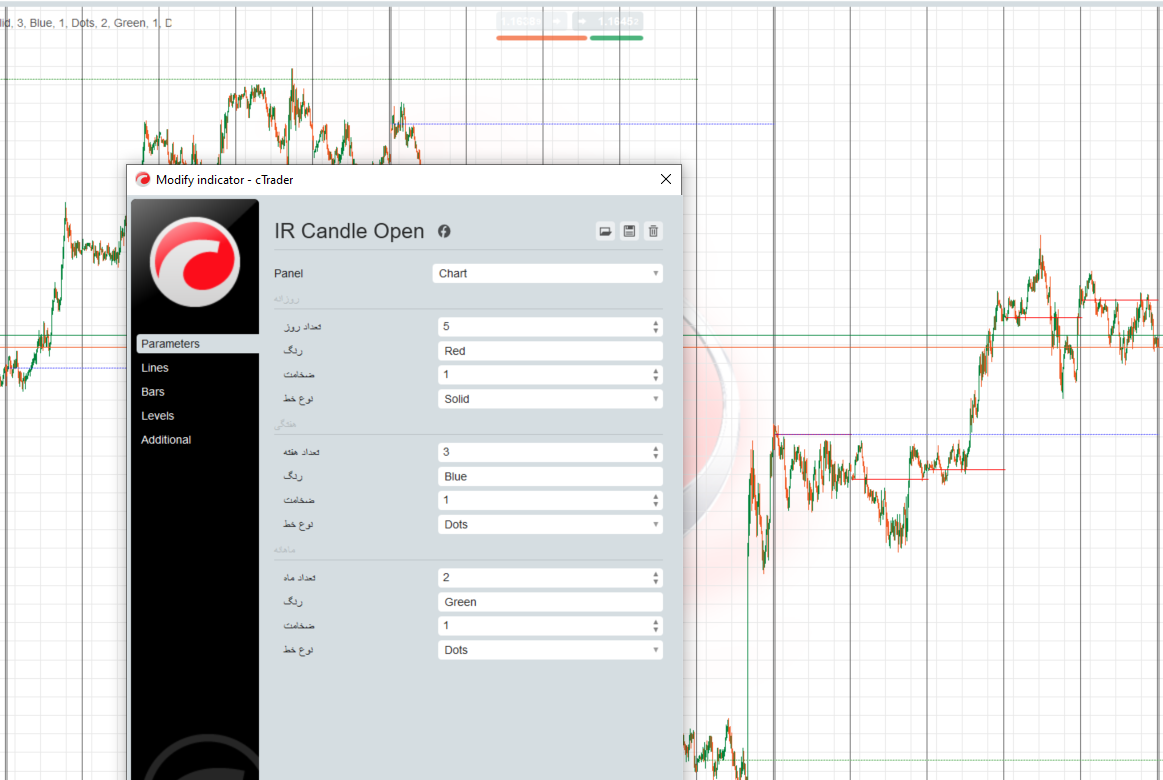
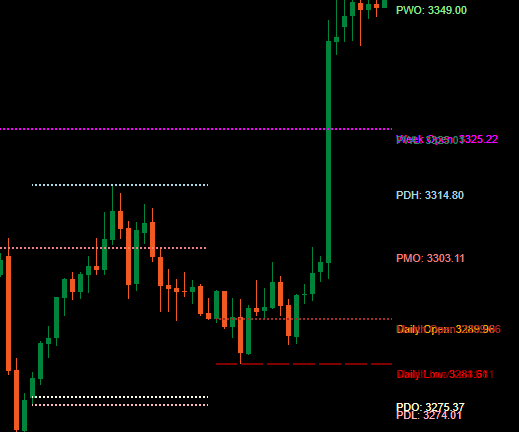
IR Candle Open
IRCtrader
Free
Indicator
IR Candle Open
IR Candle Open plots customizable opening price lines for daily, weekly, and monthly candles
Free
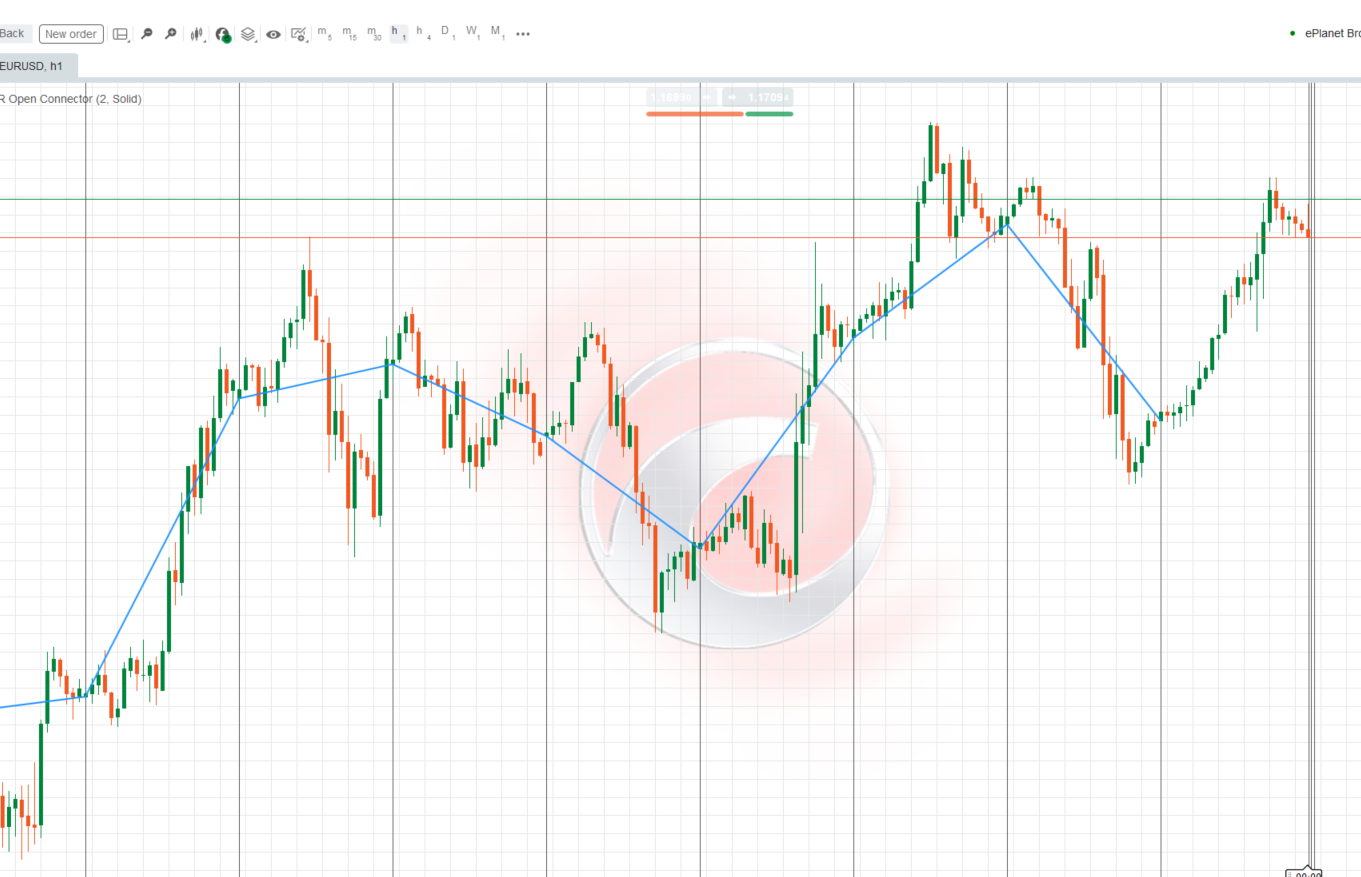
IR Open Connector
IRCtrader
Free
Indicator
IR Open Connector
This indicator connects the opening prices of higher timeframe candles (Daily, Weekly, Monthly, or
Free
You may also like
Popular
Ctreder Smart SMA Indicator
Forever_denisa
$ 30
/
$50
Indicator
Ctreder Smart SMA Indicator
cTreder Smart SMA
$ 30
/
$50
Popular
Meridian Pivot Points Pro
Magnus.Blackstone
$ 15
/
$30
Indicator
NAS100
NZDUSD
Breakout
+13
Meridian Pivot Points Pro
🚀See the market’s framework, decide faster. Session-Aware Pivots. Auto Presets. Pro-Grade Zones.🚀
$ 15
/
$30
Master Dragom SR
Goulart
5.0
(1)
Free
Indicator
Signal
Master Dragom SR
Indicator,combines with several strategies.MA locate trends,pullback, signal volumes, reversals, support and resistance
Free
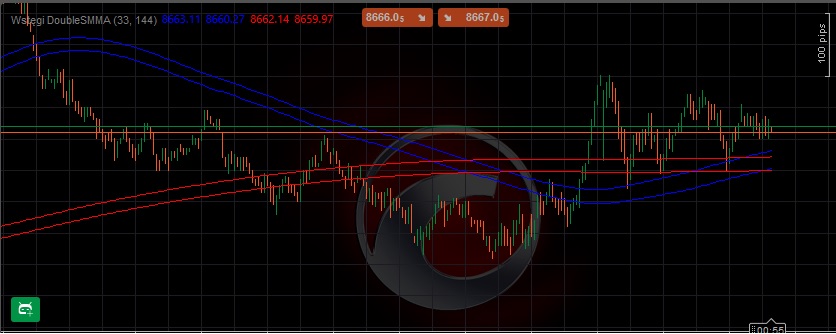
Wstęgi DoubleSMMA
Marek.oliwa
Free
Indicator
Wstęgi DoubleSMMA
Wstęgi HTS
Free
All-in-One Session Levels Suite
Dineshkumar_FX
$ 30
/
$40
Indicator
NAS100
Indices
Breakout
+6
All-in-One Session Levels Suite
Institutional Session Levels Pro OHLC,Prev(D,W,M OHLC)
$ 30
/
$40
Top-rated
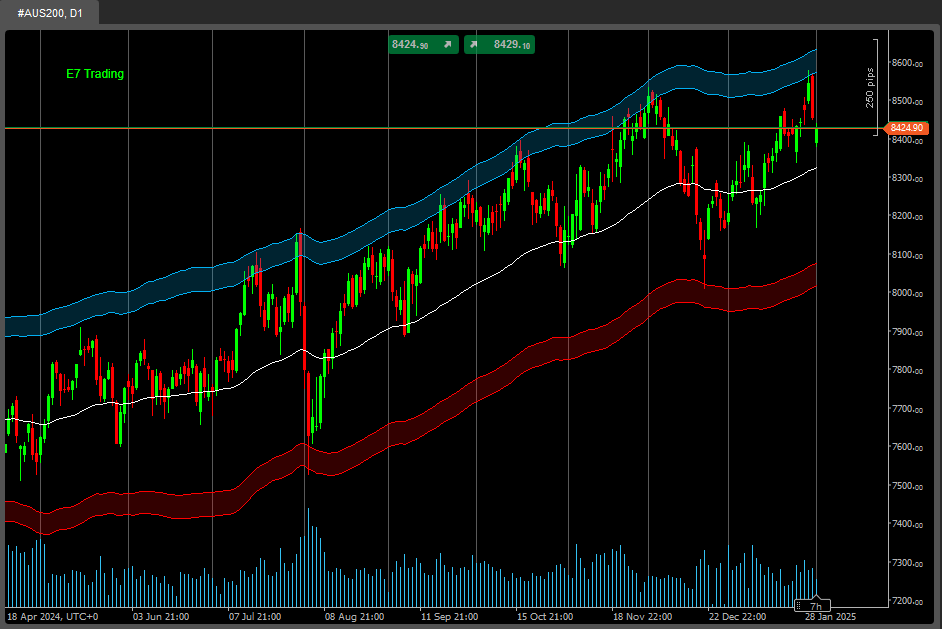
E7 Polynomial Regression Channel
Gwave
4.6
(3)
Free
Indicator
E7 Polynomial Regression Channel
Polynomial Regression Channel which also reflects the volatility of the underlying asset.
Free
Popular
ADVANCED ICT + ADR + AWR SUITE PRO
LudwigICT
$ 19
/
$38
Indicator
ADVANCED ICT + ADR + AWR SUITE PRO
ADVANCED ICT + ADR + AWR SUITE PRO (The Ultimate All-in-One Toolkit for Price Action Traders)
$ 19
/
$38
Popular
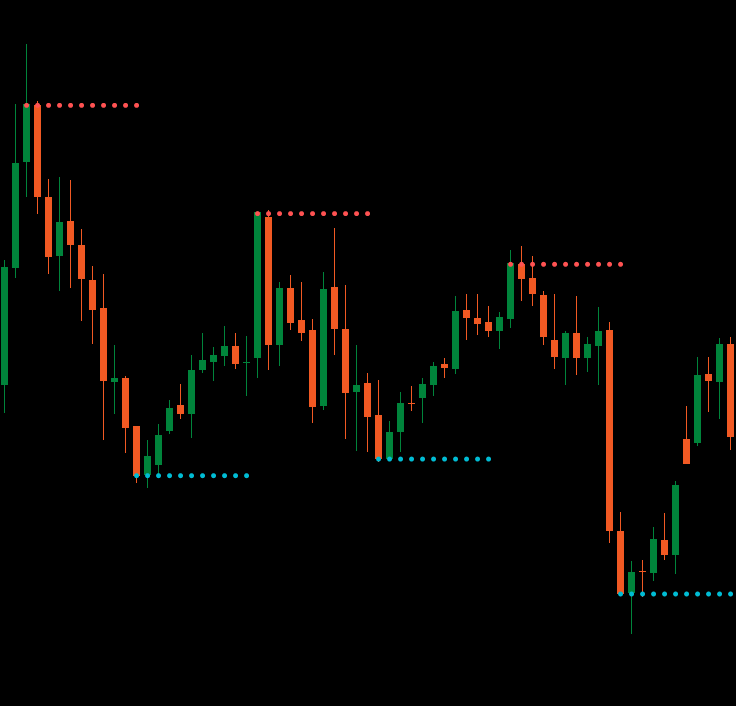
SwingHighLow
mage
$ 15
/
$20
Indicator
SwingHighLow
Auto-detect swing highs/lows. Spot reversals, map structure, and filter noise with adjustable strength.
$ 15
/
$20
SupertrendHTF
mage
$ 10
/
$15
Indicator
SupertrendHTF
Overlay higher-timeframe SuperTrend to filter noise, follow real trends, and avoid lower-timeframe whipsaws. As
$ 10
/
$15
Binary Options Signals Pro
LudwigICT
$ 10
/
$15
Indicator
Binary Options Signals Pro
Binary Options Signals Pro – Precision Trading at Your Fingertips
$ 10
/
$15
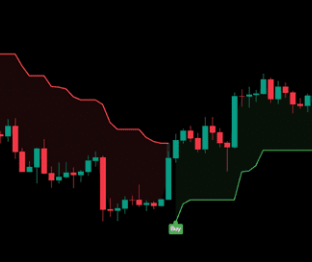
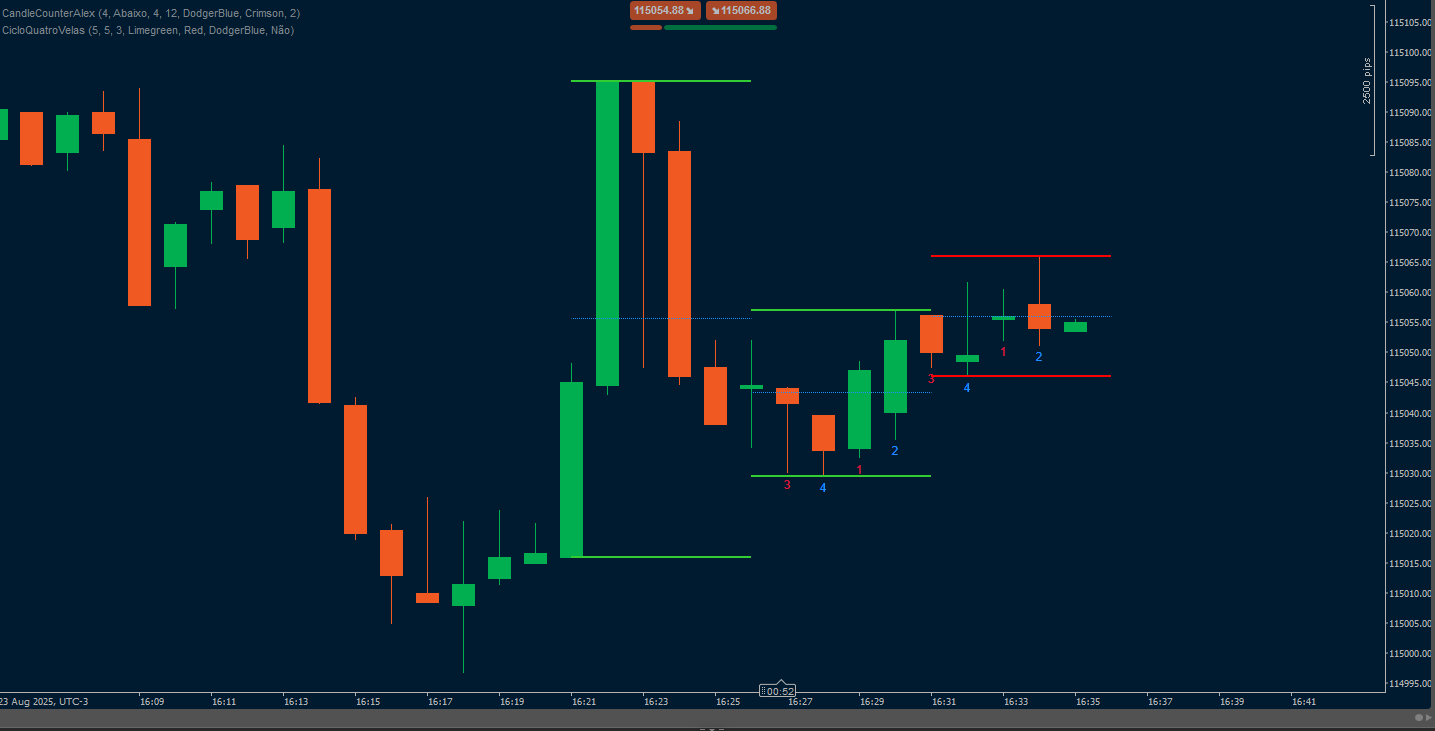
CicloQuatroVelas
Aletrader
Free
Indicator
CicloQuatroVelas
Ciclo4Velas com marcação de 50% da amplitude e muito mais ! veja na descrição e bons trades.
Free
[Hamster-Coder] Moving Average
Hamster-Coder
Free
Indicator
[Hamster-Coder] Moving Average
Universal Moving Average indicator with extended features
Free
Popular
New Way Sar - Pro
Thomas-Sparrow
$ 15
Indicator
Indices
Prop
Stocks
+6
New Way Sar - Pro
The Parabolic SAR, or "Stop and Reverse," is a dynamic technical analysis tool
$ 15
Popular
SmartFibonacci
o.elmottaqy
$ 15
/
$30
Indicator
SmartFibonacci
SmartFibonacci — automatic Fibonacci retracements & extensions with swing detection, alerts and clean labels for cTrader
$ 15
/
$30
Top-rated
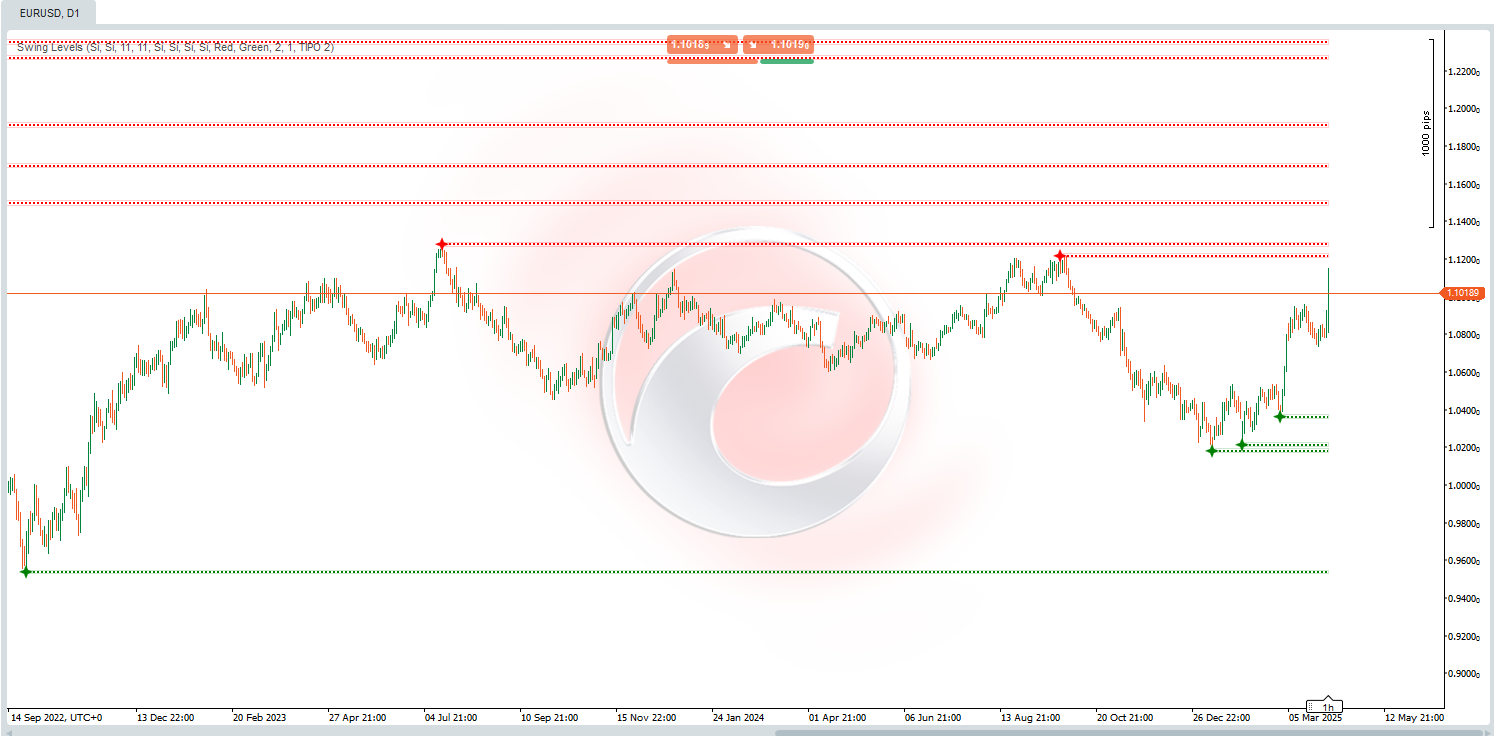
Swing Levels
pinescriptlabs
4.0
(2)
Free
Indicator
RSI
Breakout
Supertrend
Swing Levels
🔍 Automatically detect support and resistance levels based on "swings" or pivots
Free
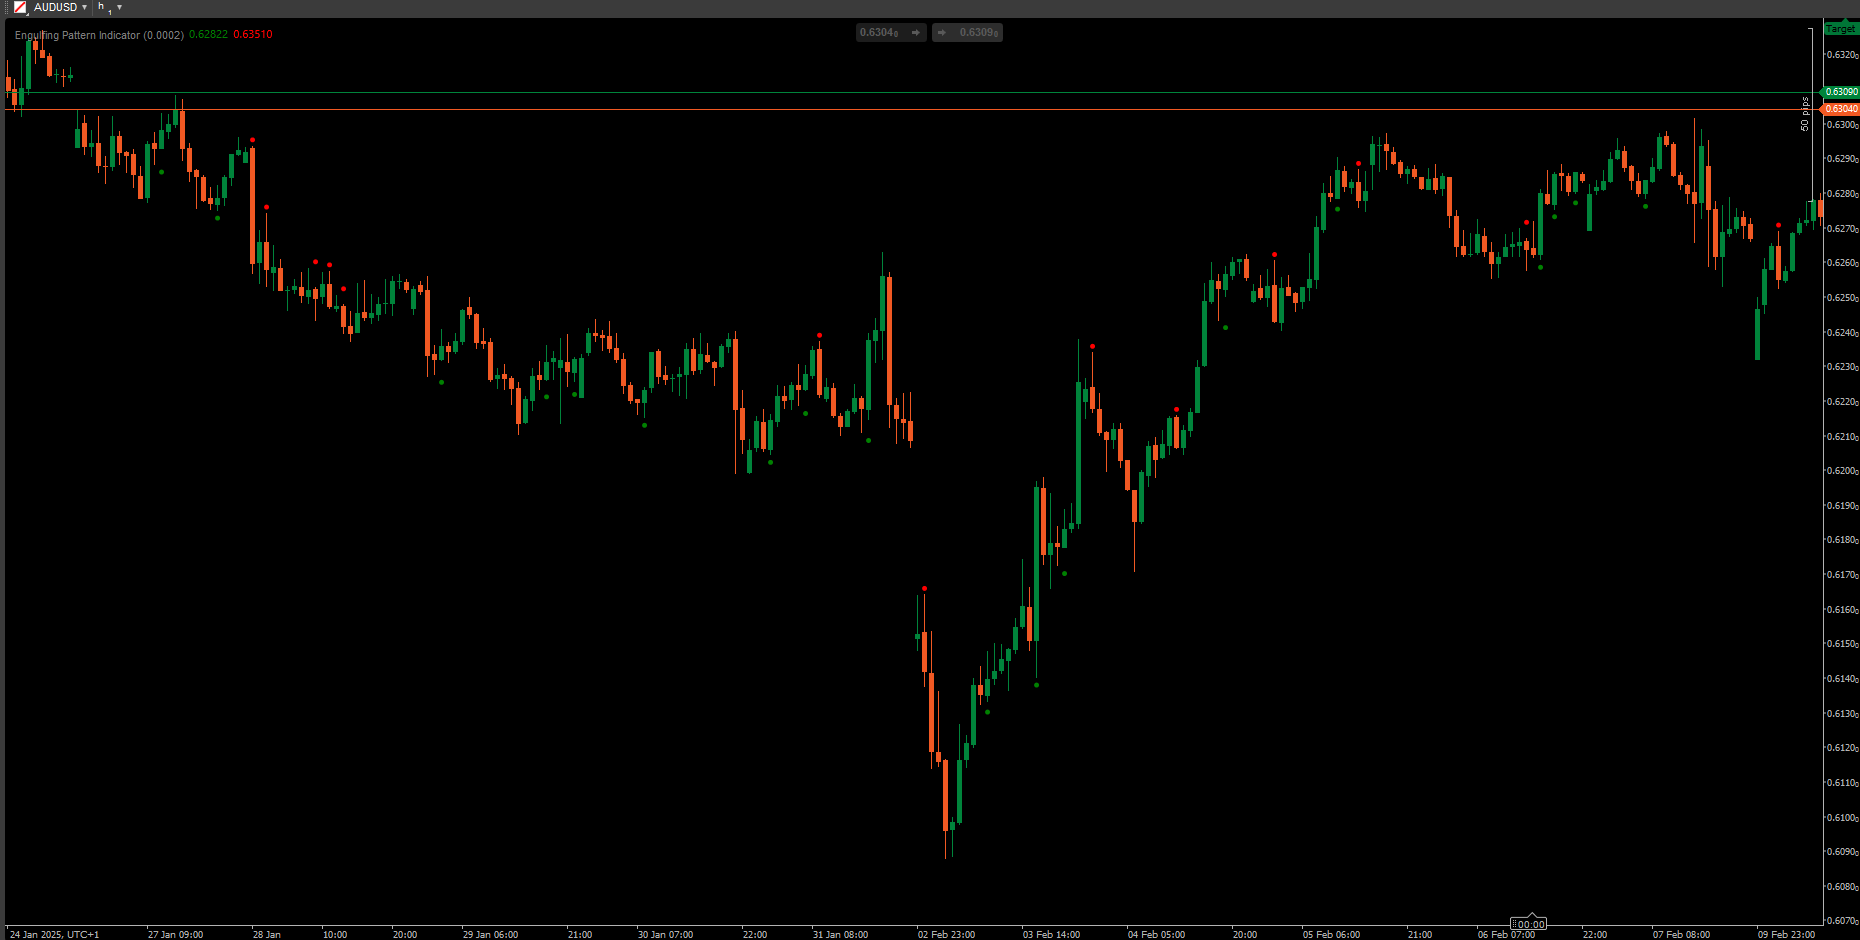
Engulfing Pattern Indicator
BrickAlgo
4.0
(1)
Free
Indicator
Stocks
Forex
Signal
+1
Engulfing Pattern Indicator
Engulfing Pattern Indicator
Free
Indicatore utbot
fabio23.traders
$ 20
/
$40
Indicator
ATR
Indicatore utbot
L'indicatore UTBot è uno strumento di analisi tecnica che crea una linea di trailing stop dinamica basata sull'ATRT
$ 20
/
$40
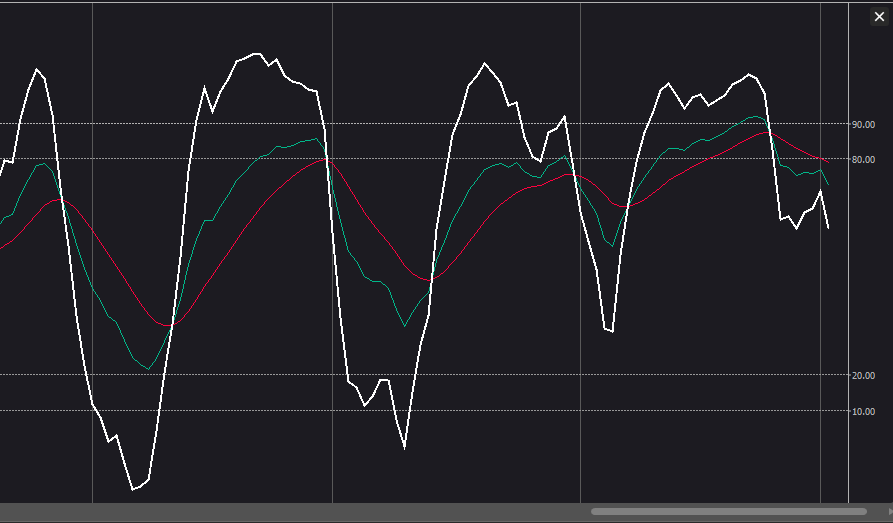
KDJ
Investion
5.0
(1)
Free
Indicator
KDJ
The KDJ oscillator display consists of 3 lines (K, D and J - hence the name of the display) and 2 levels.
Free
Load more


!["[Hamster-Coder] Moving Average" logo](https://market-prod-23f4d22-e289.s3.amazonaws.com/fd853887-8360-4212-b037-22b554a23dc6_hamster-coder-2.jpg)