Indicator
NAS100
NZDUSD
Breakout
XAUUSD
Commodities
Forex
EURUSD
GBPUSD
BTCUSD
Indices
Prop
ATR
Stocks
Crypto
USDJPY
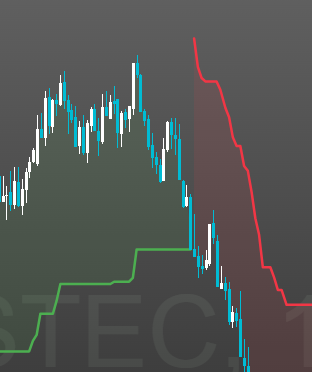
RT ATR Bands
25/09/2025
2
Desktop
Since 25/09/2024
Sales
19

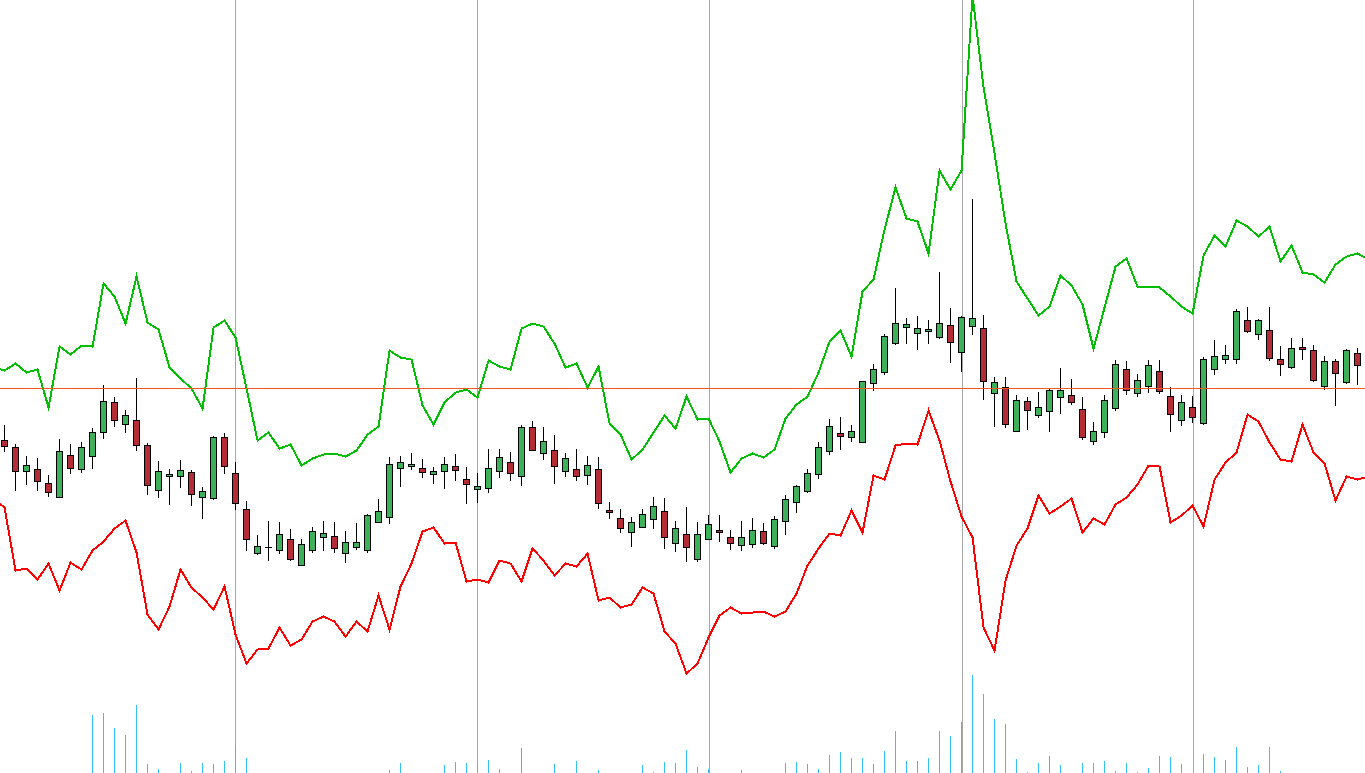
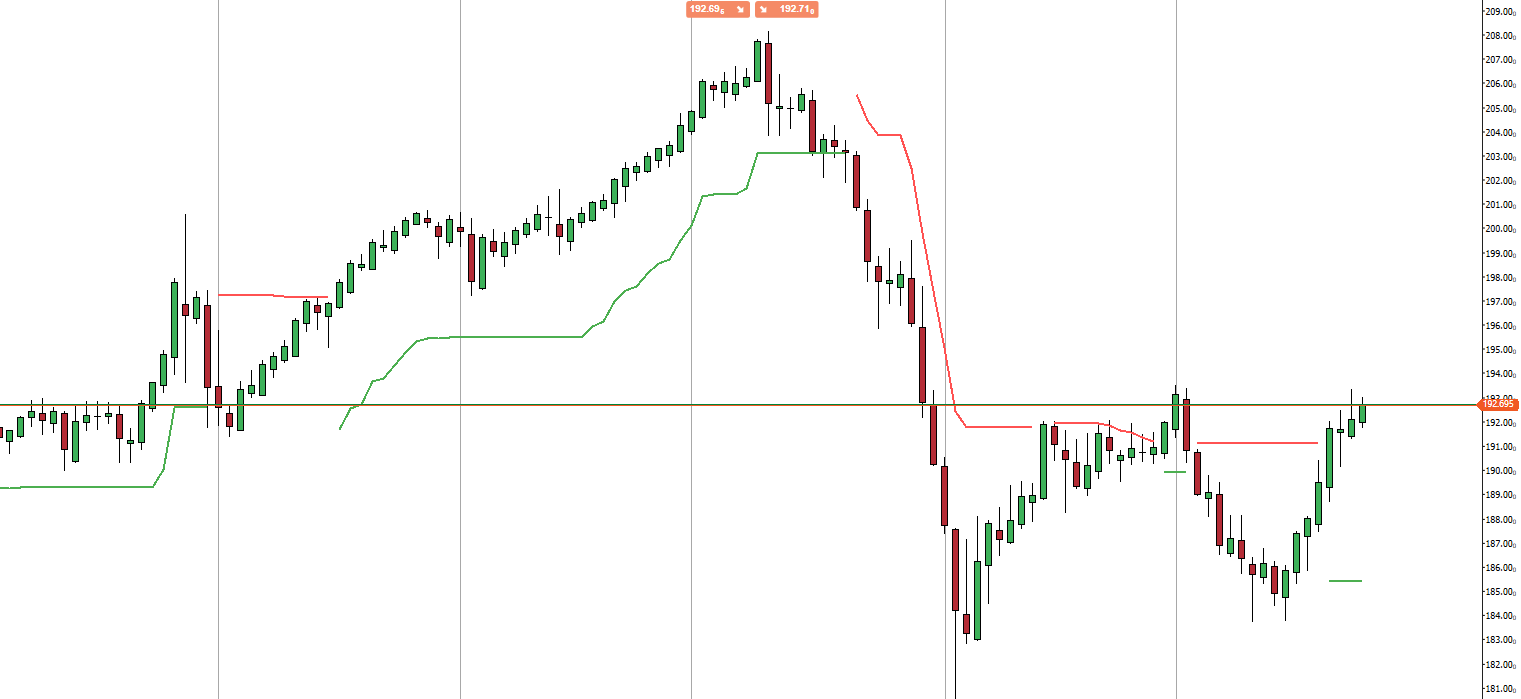
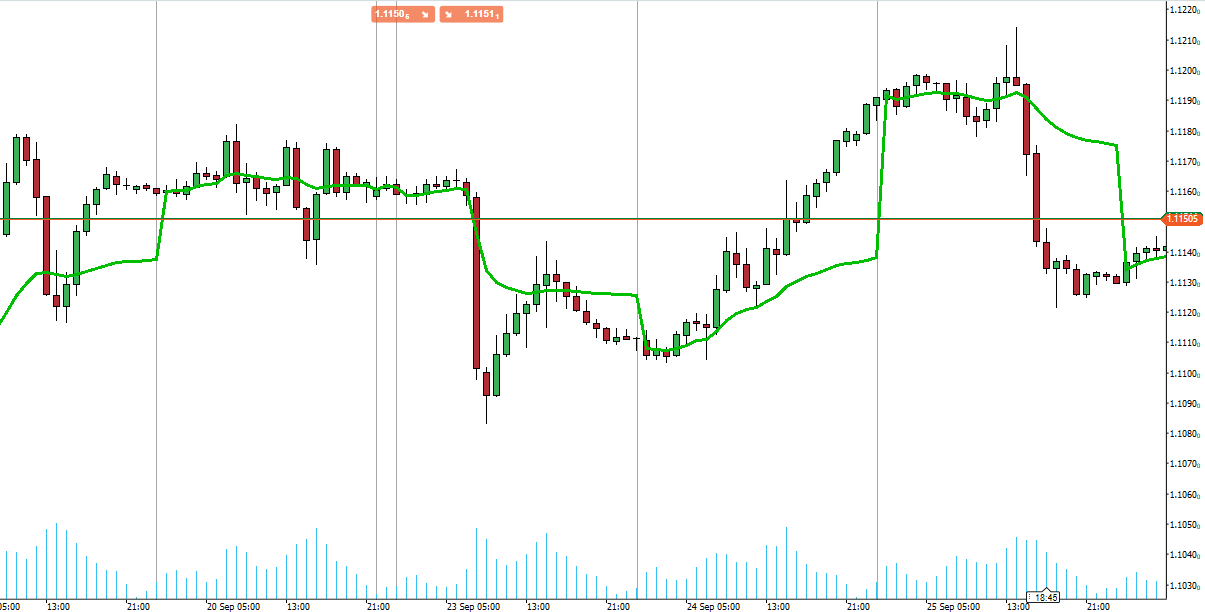
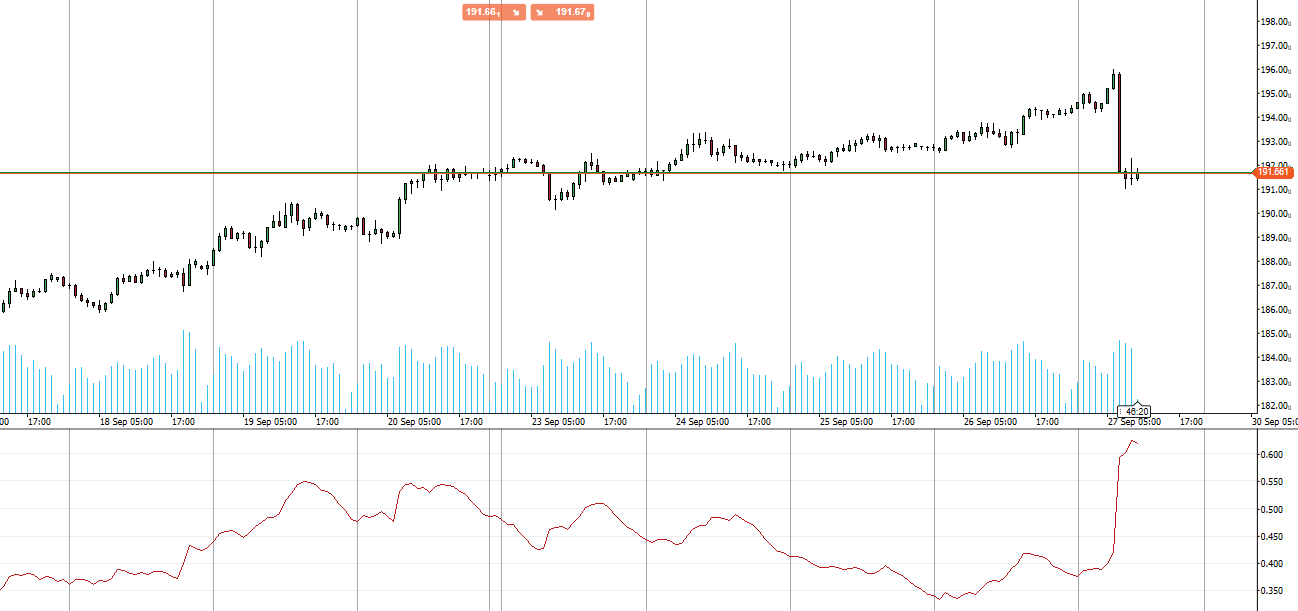
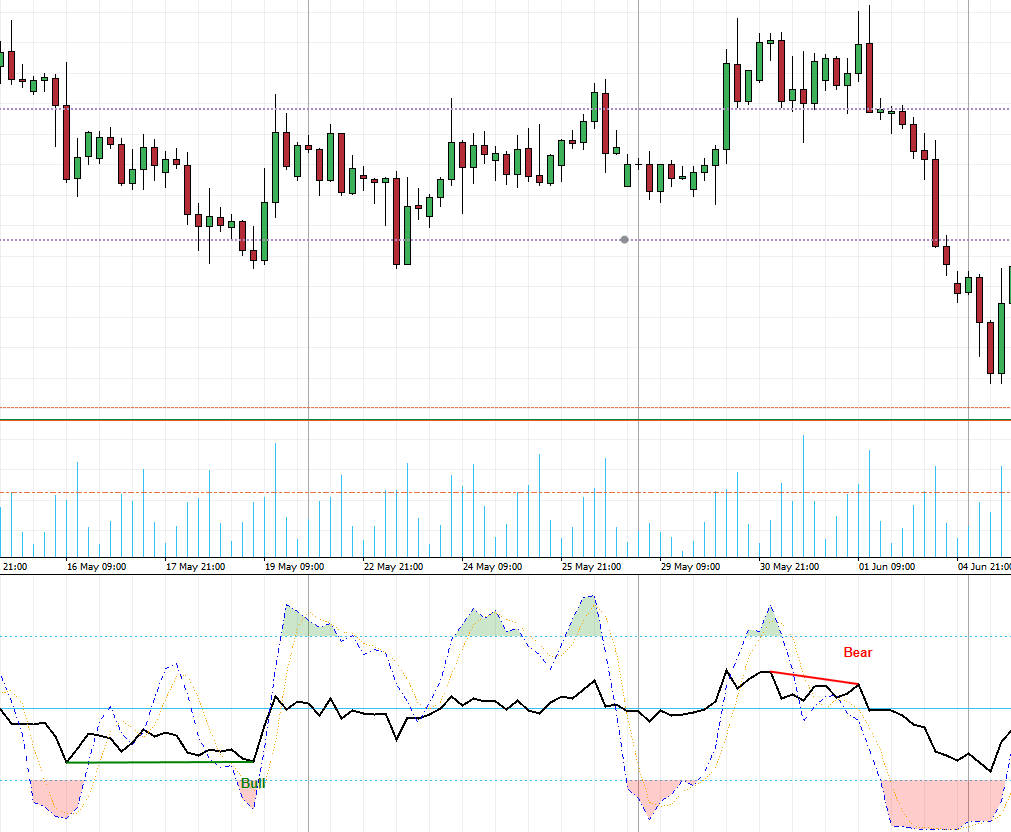
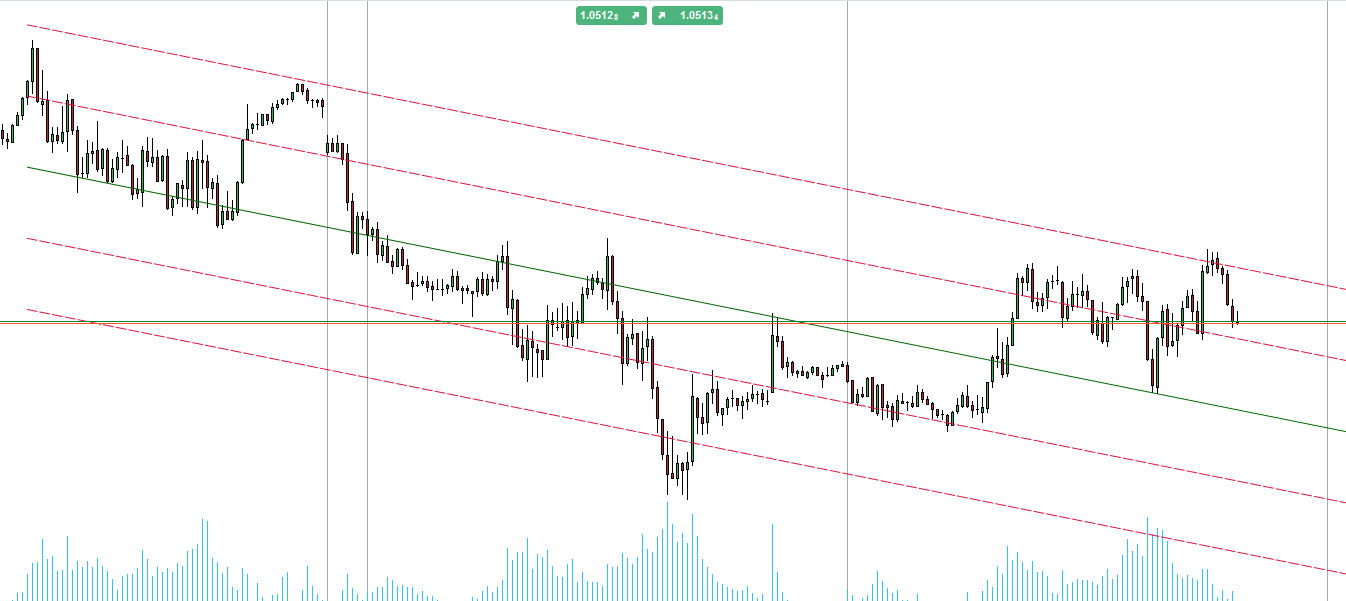
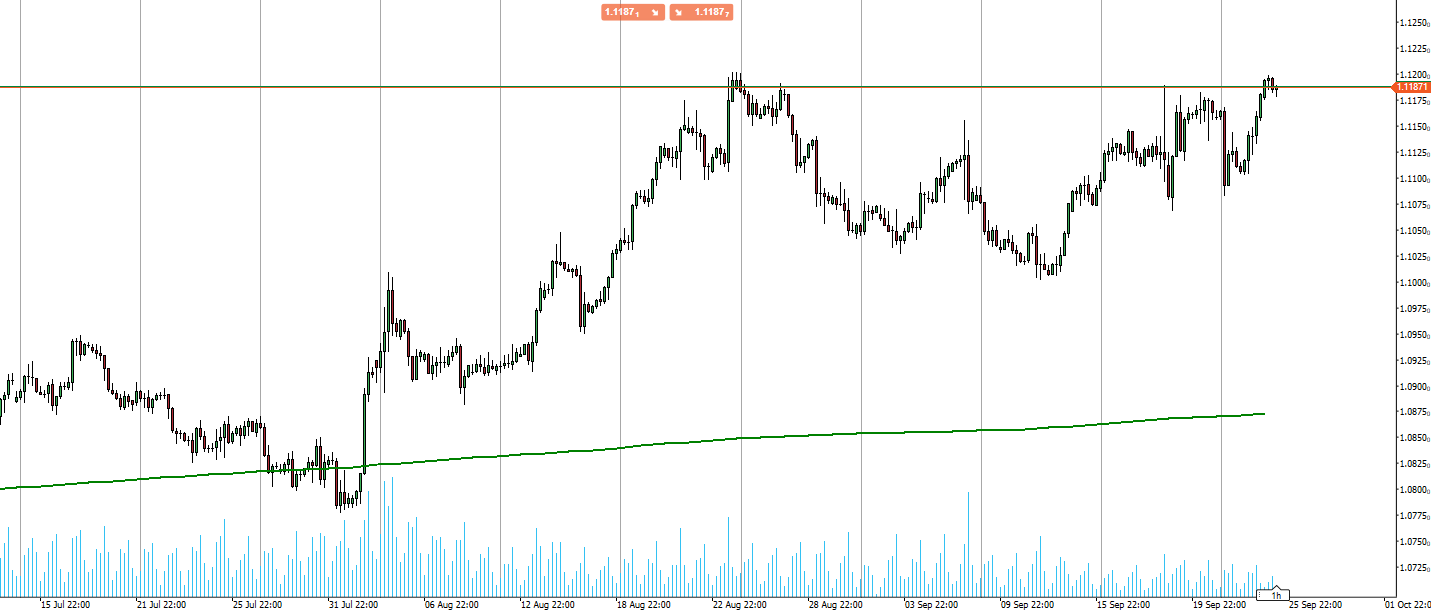
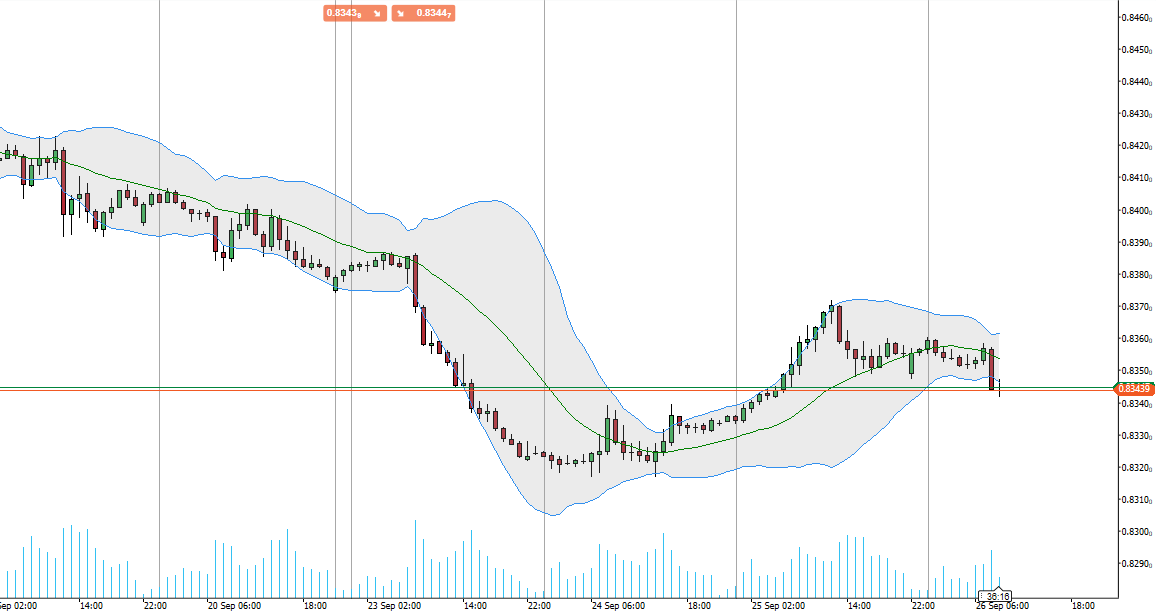
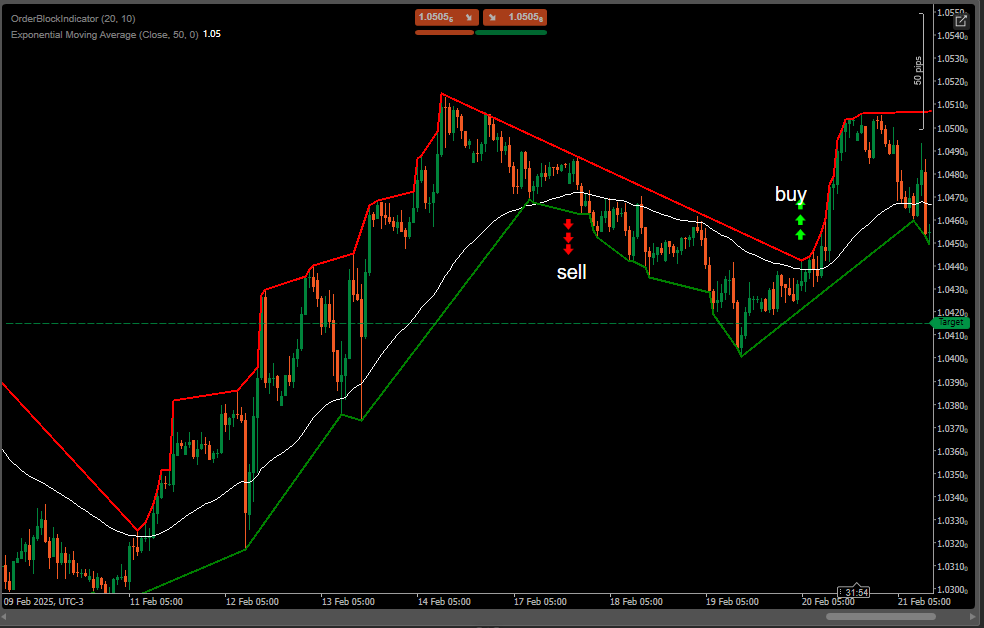
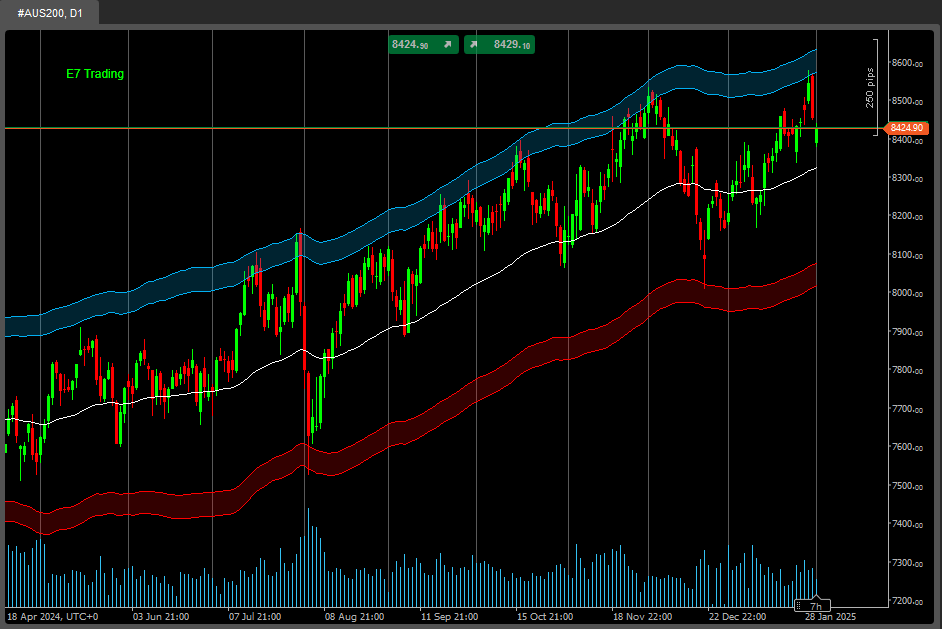
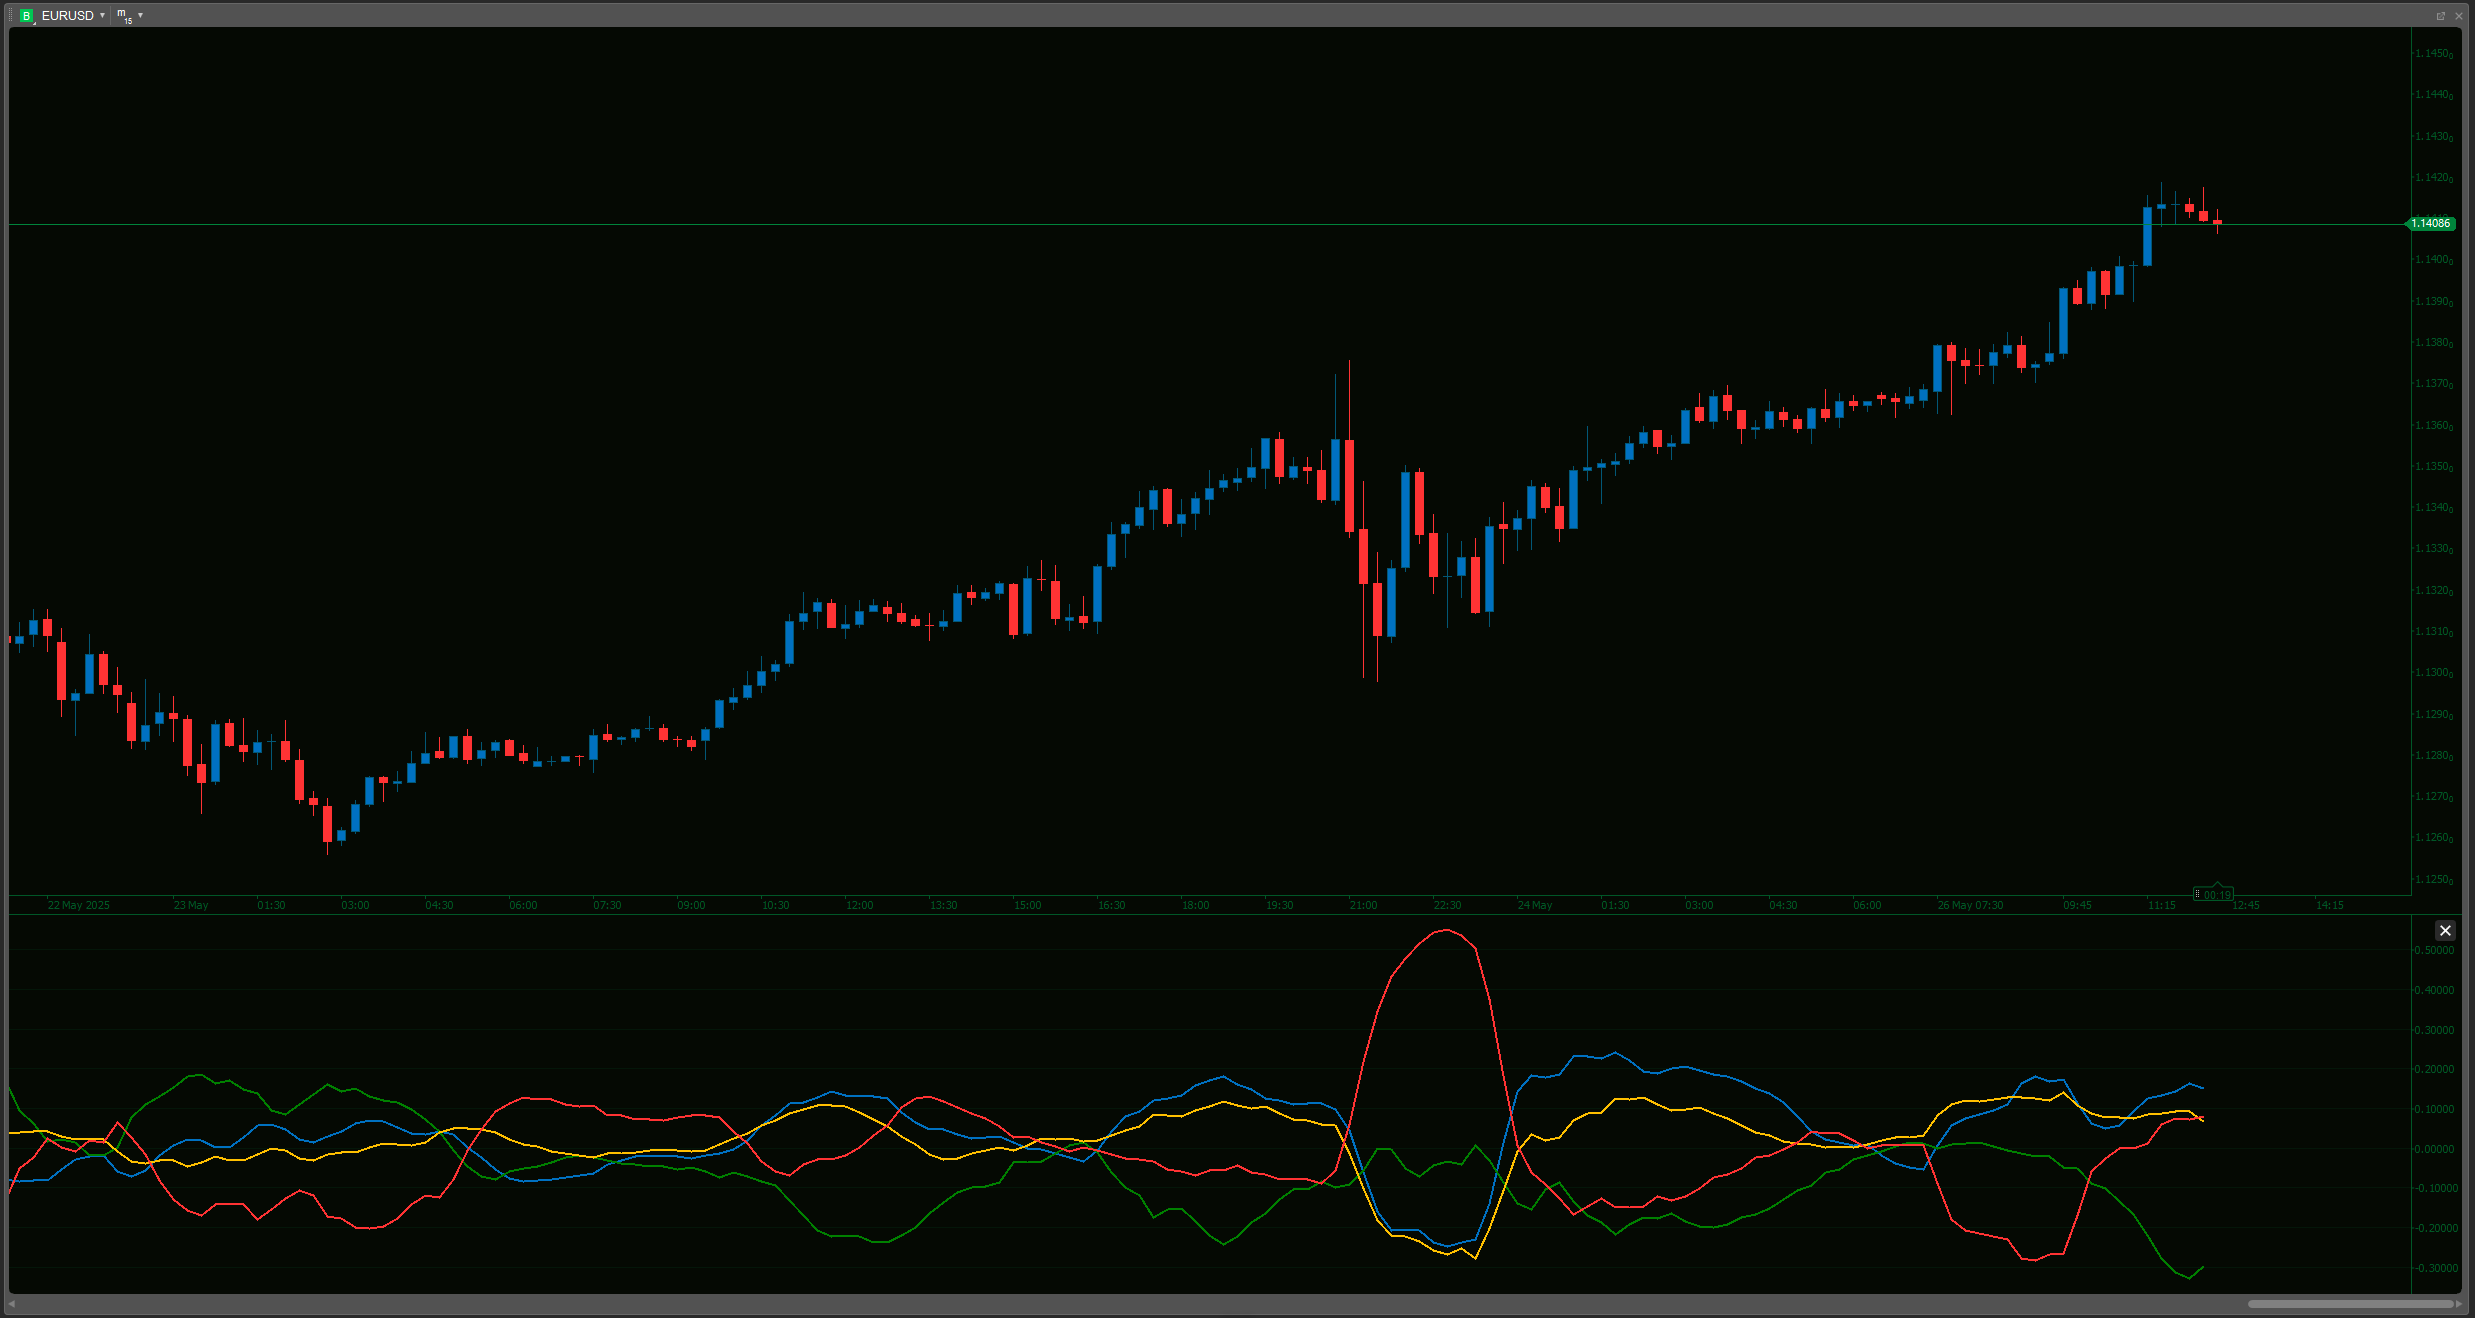
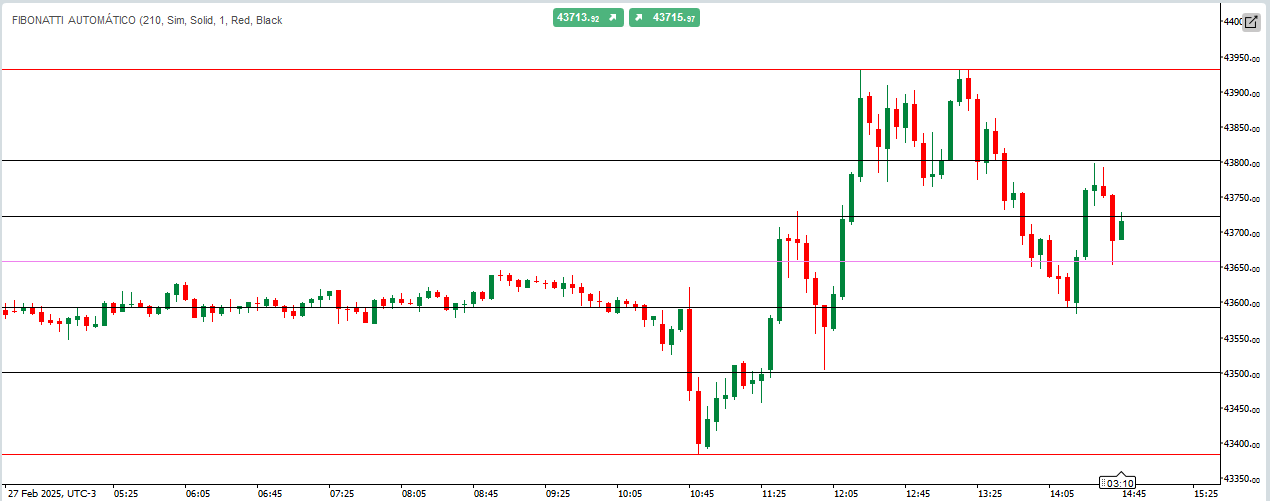
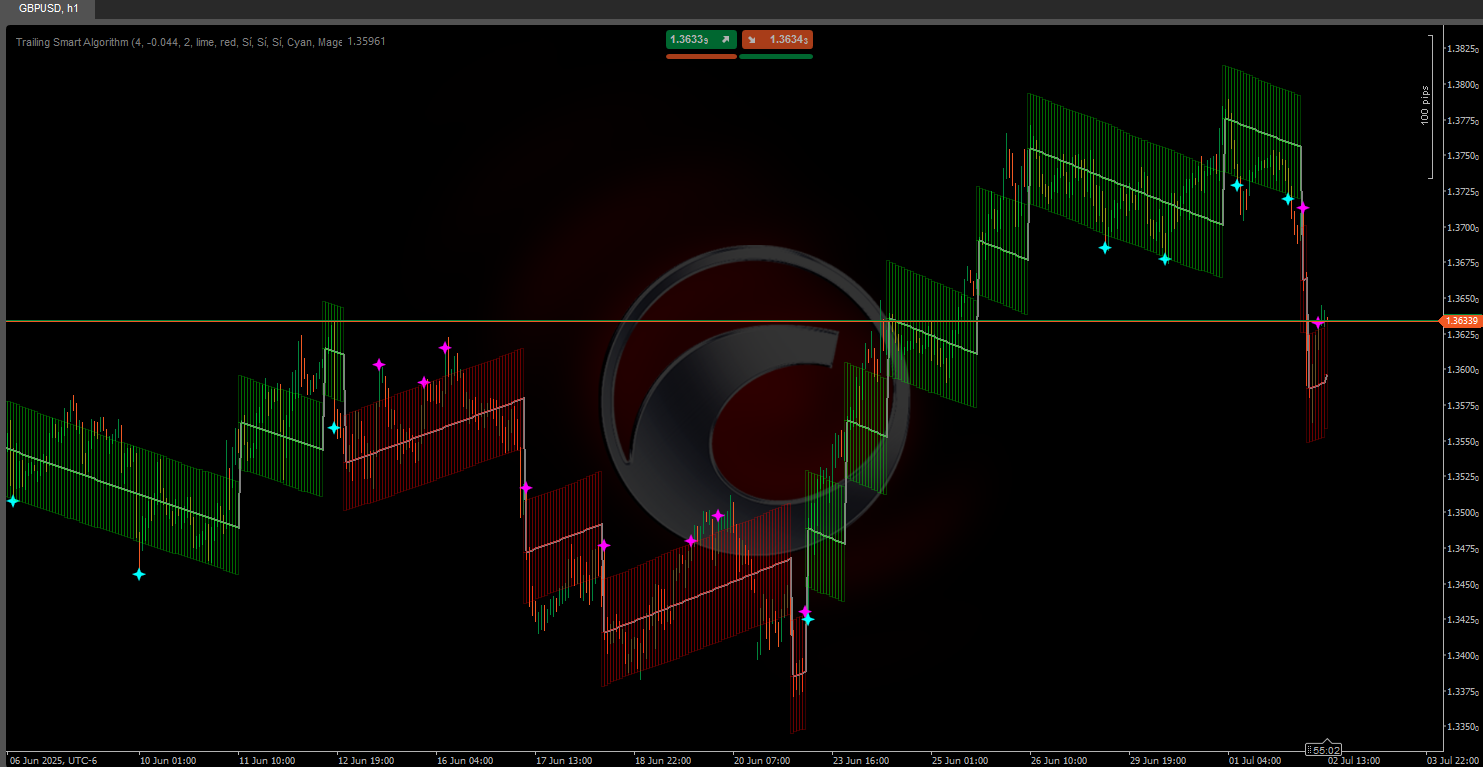
ATR Bands dynamically displays upper and lower bands on your price charts.
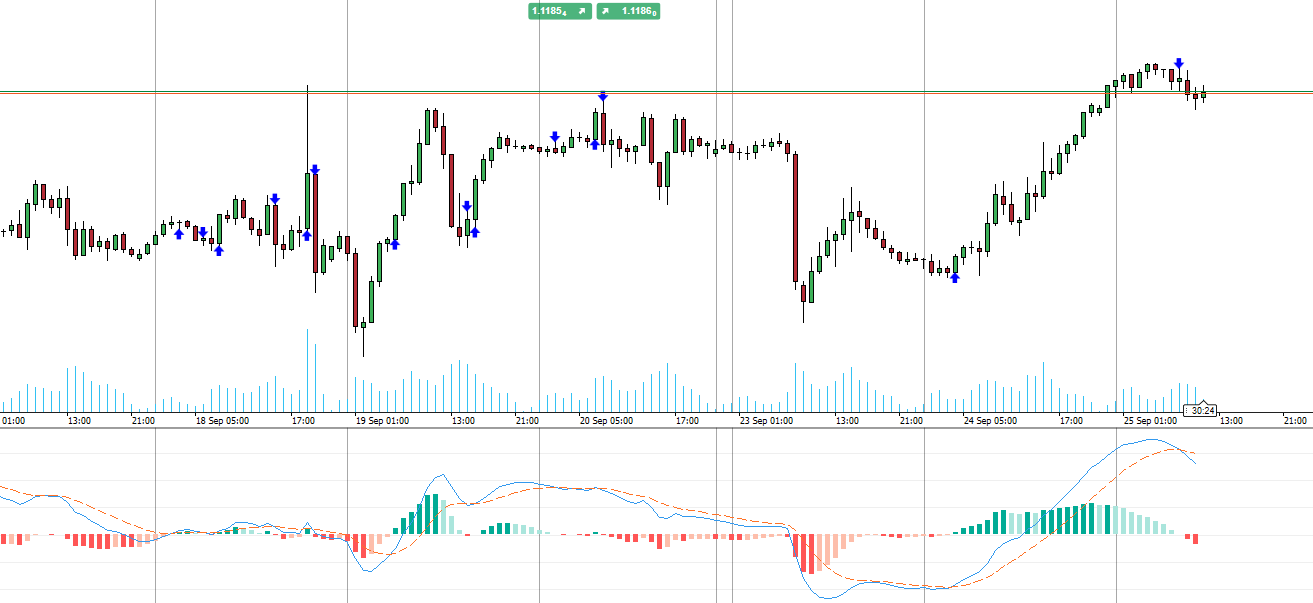
These bands offer real-time insights into market volatility, helping you identify potential breakout and reversal points with precision. Perfect for traders of all levels, ATR Bands enhance your decision-making process by providing clear visual cues for setting stop-losses, take-profits, and optimizing entry points.
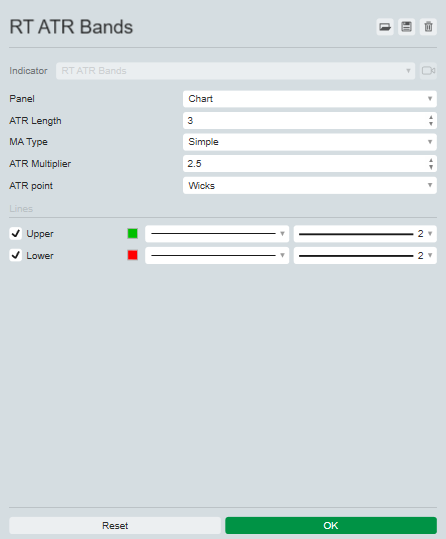
The settings allow to choose your preferred period and multiplier, change the moving average used to calculate ATR and use candle wicks or candle close.
Upgrade your trading toolkit today and experience the difference with ATR Bands – your edge in the market.
More from this author
You may also like

.png)


!["[Hamster-Coder] Moving Average" logo](https://market-prod-23f4d22-e289.s3.amazonaws.com/fd853887-8360-4212-b037-22b554a23dc6_hamster-coder-2.jpg)