Indicator
breakout
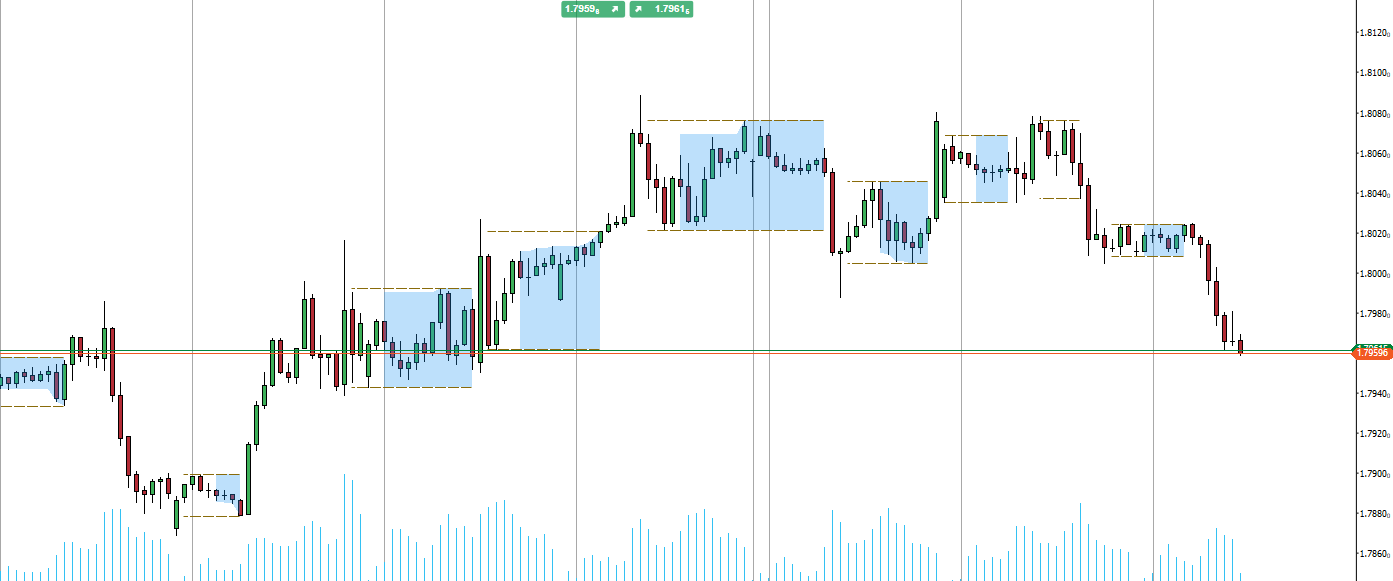

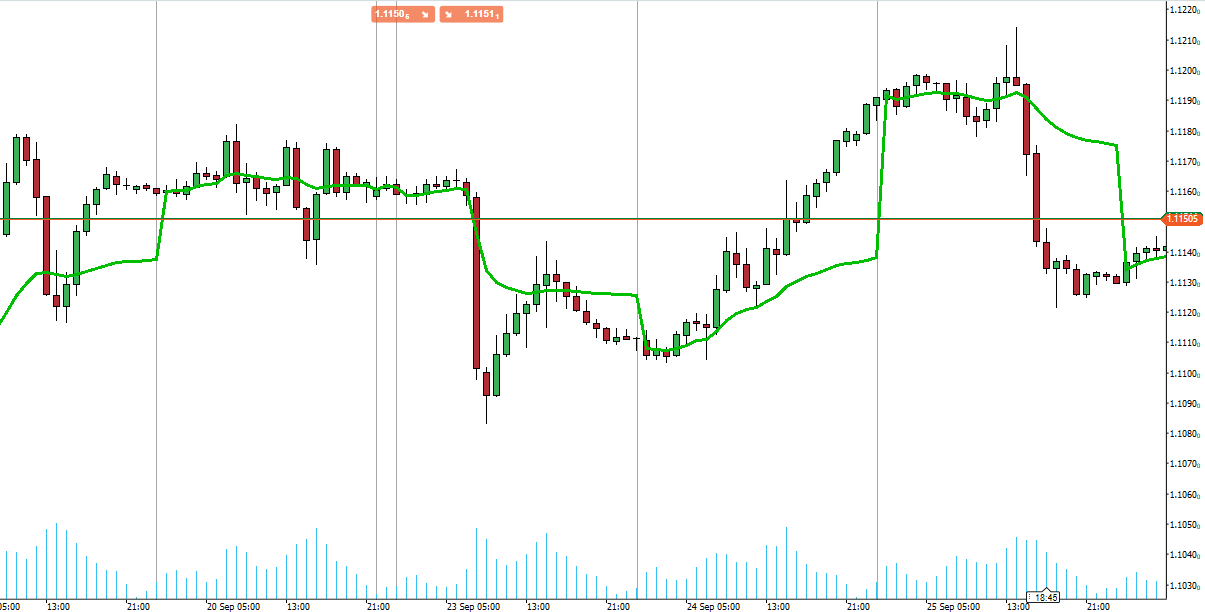
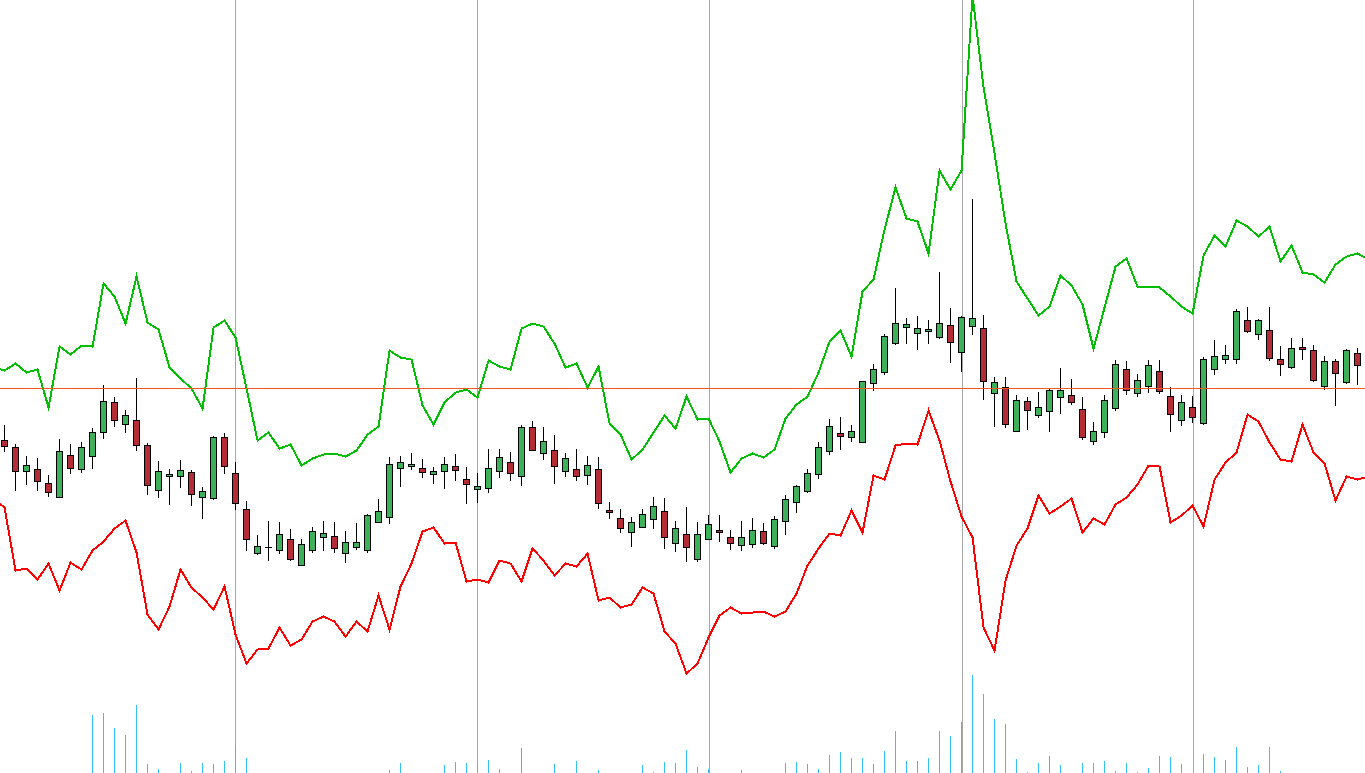
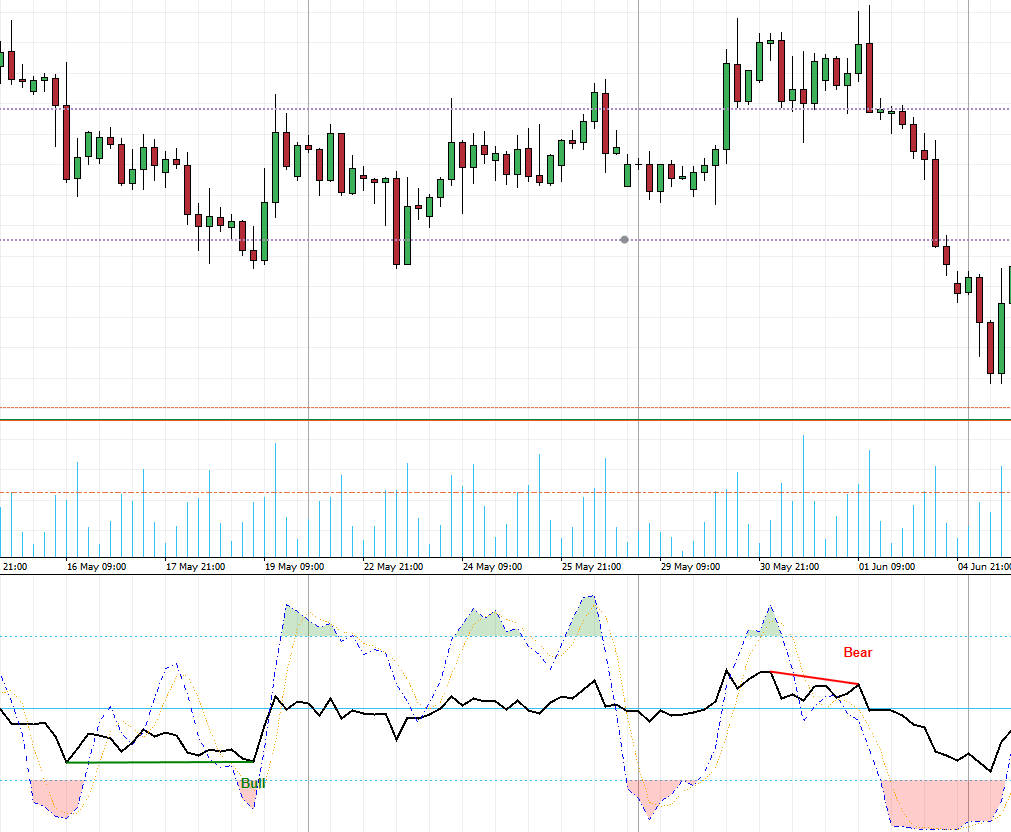
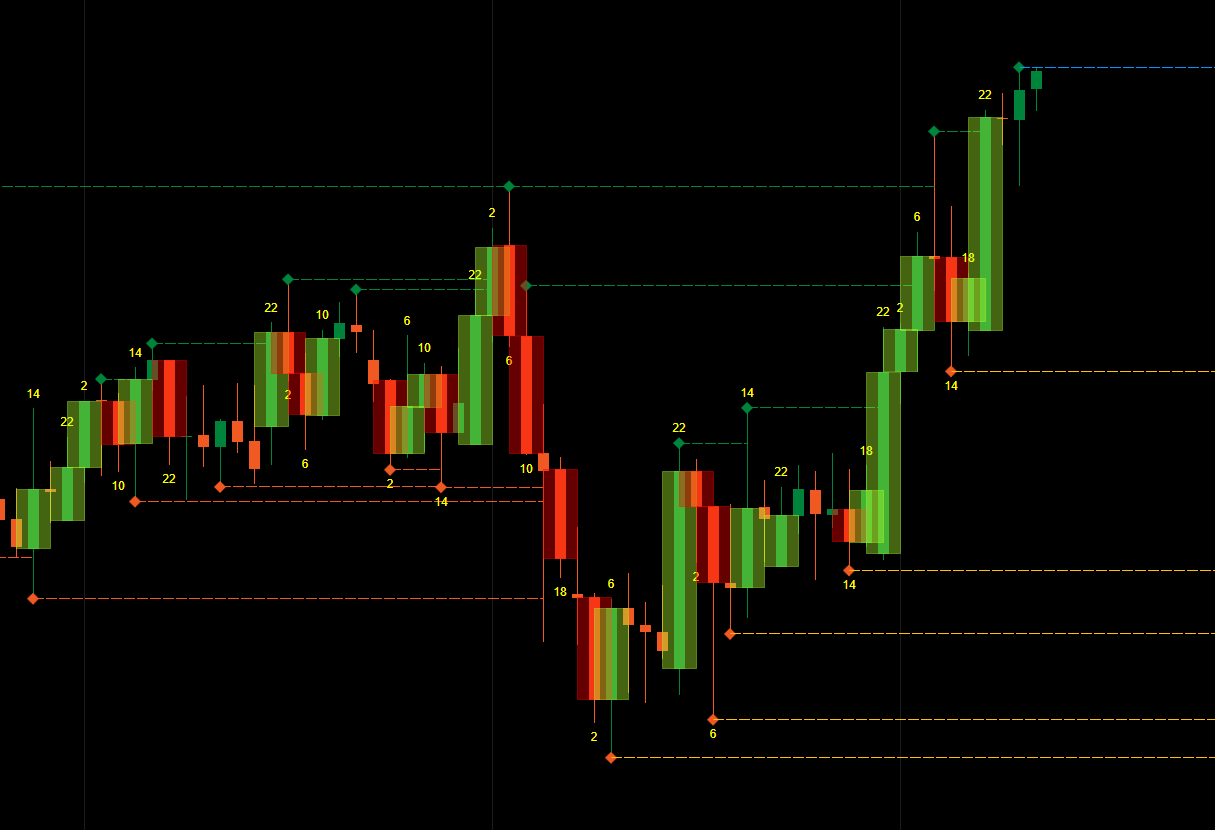
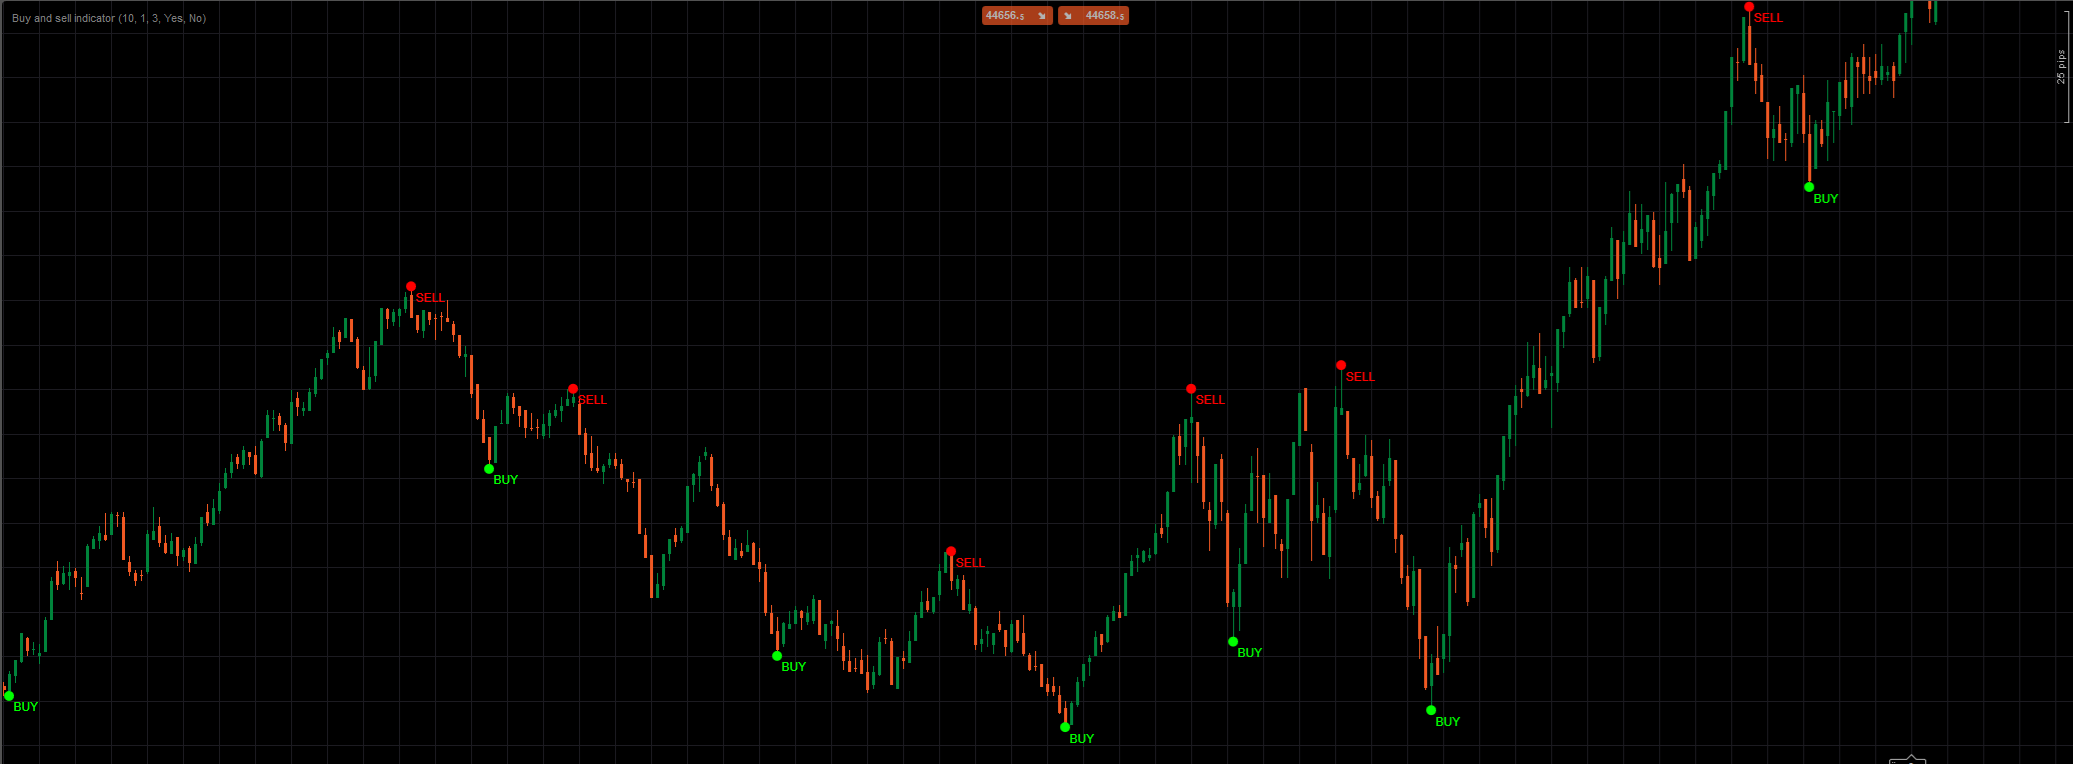
Introducing the Consolidation Zones indicator, designed to help you identify and capitalize on breakout opportunities with ease.
This powerful tool highlights zones on your chart where the price is consolidating, making it simple to spot potential breakout points. By visualizing these critical areas, you can better anticipate market movements and make more informed trading decisions.
Ideal for traders looking to enhance their strategy with clear and actionable insights, upgrade your trading toolkit and master breakouts with the Consolidation Zones indicator.
More from this author
Popular
Indicator
macd
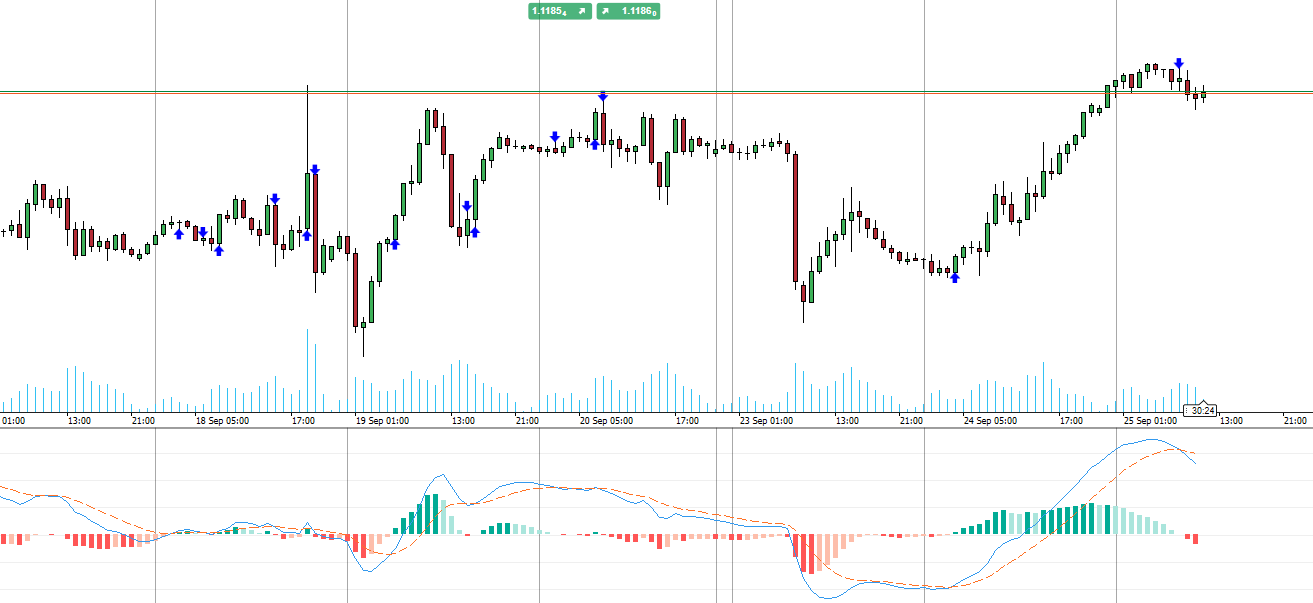
RT MACD
Customize the MACD! Choose colors, get real-time tick updates, and see crossover points for enhanced trading precision.
Indicator
atr
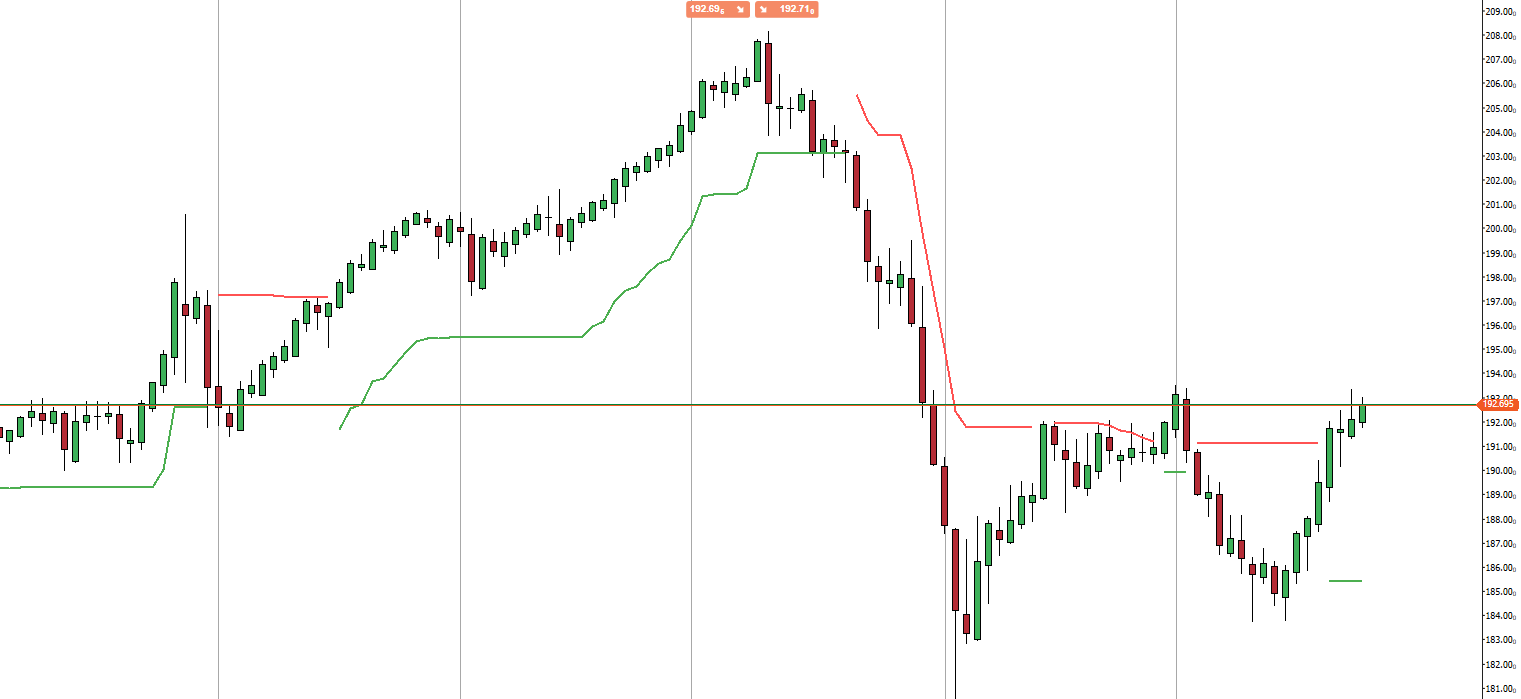
RT Chandelier Exit
Optimize exits with Chandelier Exit! Visualize stop-loss points dynamically for improved trading precision and safety.
Popular
Indicator
vwap
RT VWAP
Unlock VWAP in cTrader! Choose anchor periods, price sources, and display deviation bands with real-time tick updates.
Indicator
indices
RT True Strength Index
Enhance trading with TSI! Use the True Strength Index for clear insights into market momentum and trend strength.
Indicator
atr
RT TradingView ATR
Upgrade to ATR-RMA! Experience the precise ATR using Relative Moving Average for accurate volatility analysis in cTrader
Indicator
rsi
RT Stochastic RSI PRO
Unlock Stochastic RSI PRO in cTrader! Overlay RSI, highlight zones, and identify divergences with customizable settings.
Indicator
breakout
RT Standard Deviation Channel_noSourceCode
Visualize trends with Standard Deviation Channel! Display median, and add customizable upper/lower deviation channels.
Indicator
bollinger
RT Qualitative Quantity Estimation
Unlock trading precision with QQE! Dual QQE indicators with a Bollinger Bands zero line provide clear buy/sell signals.
Indicator
macd
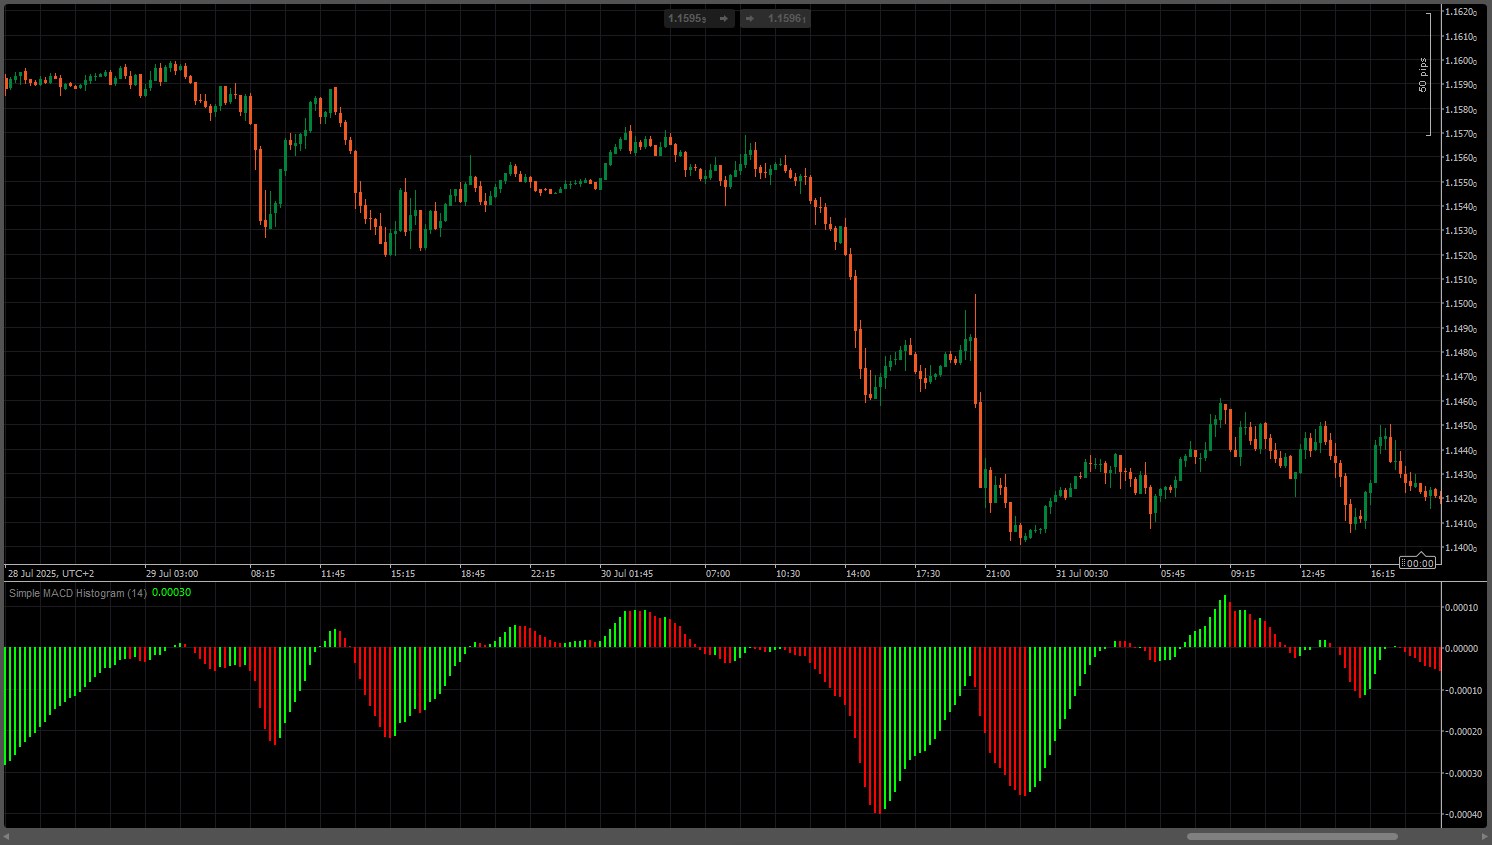
RT MACD Histogram
Enhance MACD Histogram! Visualize bull and bear price changes with vibrant colors for clearer, more insightful trading.
You may also like

Popular
Indicator
macd
NTNPICLL
NTNPICLL is a tool to check the best trading hours for the assets and also includes the highest and lowest point


!["[Hamster-Coder] Pivot Points" logo](https://market-prod-23f4d22-e289.s3.amazonaws.com/3c48c5d9-506b-4c95-a900-819a312f8649_Icon300.jpg)


Popular
Indicator
scalping
Pivot Point Smart Money Concept
Transform your approach to trading with our innovative Pivot Point Indicator.