
Simple MACD Histogram
Indicator
253 downloads
Version 1.0, Aug 2025
Windows, Mac
Description
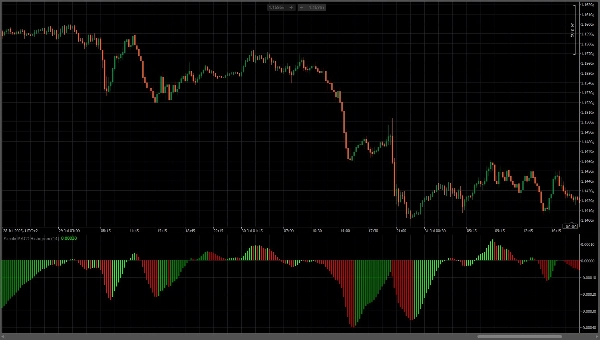
This custom MACD Histogram indicator displays the MACD histogram with enhanced visual clarity styling. The indicator uses a fast EMA period of 14, automatically calculates the slow EMA as fast plus 2 (16). The indicator features highly contrasted color-coding for instant trend recognition: bright green bars indicate rising momentum (bullish), while red bars show falling momentum (bearish). The histogram bars extend symmetrically from a center zero line, creating an intuitive visual representation where green signals buy pressure and red signals sell pressure. This visualization style provides clear, unambiguous momentum signals and helps identify potential trend reversals and momentum shifts in price action.
Summary
AI summary
The Simple MACD Histogram is a custom technical indicator designed to visually represent momentum in price action. It calculates a fast EMA with a period of 14 and a slow EMA set automatically to 16 (fast EMA plus 2). The histogram bars extend symmetrically from a zero line, with bright green bars indicating rising (bullish) momentum and red bars indicating falling (bearish) momentum. This color-coded display enhances clarity for quick trend recognition, helping users identify potential trend reversals and shifts in momentum. The indicator is intended for use in trading analysis to provide clear, unambiguous signals of buy and sell pressure.
Indicator profile
Customer reviews
0.0
Reviews: 0
Customer reviews
No reviews for this product yet. Already tried it? Be the first to tell others!
Discussion
FAQ
Products available through cTrader Store, including trading bots, indicators and plugins, are provided by third-party developers and made available for informational and technical access purposes only. cTrader Store is not a broker and does not provide investment advice, personal recommendations or any guarantee of future performance.


!["[Hamster-Coder] Moving Average MTF" logo](https://cdn.ctrader.com/image/webp/b11b98b1-194d-4b8e-b00e-d611826ad159_31226)


Price
Since 15/06/2025
662
Free installs