
Descripción
📊 VALOR ESPERADO VPOC MONTE CARLO
https://chartshots.spotware.com/c/69c558e2c68df
Análisis de Mercado Integrado: Perfil de Volumen + Proyección Estadística 🎯
🎯 ¿QUÉ ES?
El Valor Esperado VPOC Monte Carlo es un indicador de análisis cuantitativo que combina dos metodologías profesionales de trading:
- Perfil de Profundidad de Mercado (VPOC) - Identifica dónde está realmente concentrado el volumen 🏦
- Simulación Monte Carlo - Proyecta escenarios futuros basados en probabilidades estadísticas 📈
El resultado es un sistema de análisis que te dice dónde está el dinero (Punto de Control) y hacia dónde es probable que vaya (Valor Esperado proyectado) 🧠
⚙️ ¿CÓMO FUNCIONA?
Módulo 1: Perfil de Profundidad (VPOC) 📊
El indicador analiza las últimas 200 barras (configurable) y distribuye el volumen en 30 niveles de precio. Calcula:
- Punto de Control (PoC): El precio con mayor volumen negociado - representa el consenso del mercado donde compradores y vendedores estuvieron más activos ⚖️
- Delta: Diferencia entre presión de compra y venta en cada nivel 🔄
- Mapa de calor: Visualización de la concentración de actividad 🔥
La lógica: El precio tiende a revertir hacia el PoC porque ahí reside la mayor liquidez pendiente. Si el precio está lejos del PoC, hay mayor probabilidad de retorno 🔄
Módulo 2: Proyección Estadística (Monte Carlo) 🎲
Utiliza simulaciones estocásticas (1,000 iteraciones por defecto) para proyectar el precio futuro:
- Calcula la tendencia histórica del activo y la volatilidad anualizada 📉📈
- Genera caminos aleatorios usando una distribución normal (modelo de movimiento browniano geométrico) 🌊
- Estima el Valor Esperado con bandas de desviación estándar (±1 sigma) 📏
Fórmula aplicada: - Deriva por barra = Retorno anualizado / días de trading 🧮
- Volatilidad por barra = Volatilidad anualizada / √días ⚡
- Proyección = Precio actual × e^(deriva total + aleatorio normal × volatilidad total) 🔢
Módulo 3: Sinergia 🔗
Combina ambos análisis para generar señales contextuales:
Tabla
Señal Condición Significado
ALCISTA ↑ 🟢 Precio > PoC + Proyección positiva Tendencia alcista confirmada por volumen
BAJISTA ↓ 🔴 Precio < PoC + Proyección negativa Tendencia bajista confirmada por volumen
OPORTUNIDAD ★ 💡 Precio < PoC + Proyección positiva Posible rebote desde soporte de volumen
DIVERGENCIA ⚠️ ⚠️ Precio > PoC + Proyección negativa Advertencia de posible reversión
📈 ¿PARA QUÉ SE USA?
✅ Identificar niveles clave de volumen - El PoC actúa como un imán de precio 🧲
✅ Estimar probabilidades de éxito - Porcentaje de escenarios ganadores en la simulación 🏆
✅ Evaluar riesgo/recompensa - Ratio de Sharpe proyectado y desviación estándar 📊
✅ Confirmar dirección de la operación - Sinergia entre posición relativa al PoC y momentum estadístico 🎯
✅ Proyección de objetivo - Niveles de precio esperados para el periodo de retención definido 🎯
🎮 CONFIGURACIÓN Y USO
Parámetros principales:
Tabla
Grupo Parámetro Predeterminado Descripción
Análisis de Perfil de Profundidad 200 barras Historial para calcular perfil de volumen
Niveles de Precio 30 Resolución del perfil (más niveles = más detalle) 🔍
Desplazamiento Horizontal 5 Posición del perfil en el gráfico 📏
Proyección Estadística Duración Máxima de Operación 252 barras Horizonte temporal de la proyección ⏱️
Capital Invertido $1,000 Base para cálculos monetarios 💰
Simulaciones 1,000 Número de caminos aleatorios (más = más preciso, más lento) 🔄
Tasa Libre de Riesgo 5% Para cálculo del Ratio de Sharpe 📉
Estrategia Histórica Usar TP/SL No Activar para simular con objetivos fijos 🎯
Cómo interpretar la tabla de resultados:
plain
Copy
ESTADÍSTICAS DE VALOR ESPERADO
┌──────────────┬─────────┬─────────┬─────────┬────────┐
│ Método │ $ Monto│ % Retorno│ Tasa de Éxito│ Sharpe │
├──────────────┼─────────┼─────────┼─────────┼────────┤
│ Histórico │ -$19.56 │ -1.96% │ 47.2% │ -1.24 │
│ Simulación │ -$54.05 │ -5.40% │ 21.4% │ -4.95 │
└──────────────┴─────────┴─────────┴─────────┴────────┘
- Histórico: Rendimiento promedio de operaciones similares pasadas 📜
- Simulación: Resultado promedio de las 1,000 simulaciones Monte Carlo 🎲
- Tasa de Éxito: Porcentaje de escenarios con resultado positivo ✅
- Sharpe: Retorno ajustado al riesgo (mayor que 1 es bueno, negativo es malo) 📈
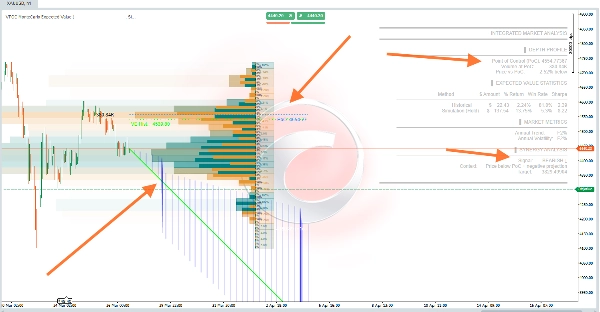
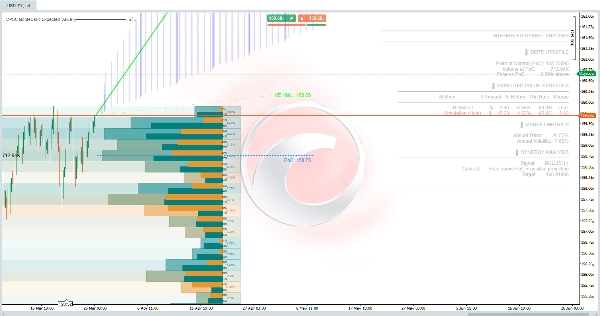
🖼️ Elementos Visuales en el Gráfico
Tabla
Elemento Color Significado
Perfil de volumen Degradado naranja/azul Concentración de actividad por nivel de precio 🎨
Línea PoC Azul punteada Punto de Control proyectado hacia el futuro 🔵
Línea de proyección EV Verde/Magenta Trayectoria esperada del precio 🟢🔴
Banda ±1σ Líneas blancas punteadas Rango de confianza del 68% 📊
Línea EV histórica Verde punteada Valor esperado basado en datos históricos 🟢
Zona de proyección Relleno azul translúcido Área de probabilidad entre bandas 🔵
⚠️ IMPORTANTE - Limitaciones
- No es una señal de compra/venta - Es una herramienta de análisis probabilístico 🛠️
- Las simulaciones Monte Carlo asumen que la distribución histórica se mantiene (no predice eventos cisne negro) 🦢❌
- El PoC es dinámico - Se recalcula en cada nueva barra 🔄
- Requiere suficiente historial - Mínimo 252 barras para proyecciones confiables 📊
- Criptomonedas - El indicador se ajusta automáticamente a 365 días de trading anual vs 252 para mercados tradicionales 🪙
💡 Estrategia de Uso Recomendada
- Busca OPORTUNIDAD ★ 💡 - Precio por debajo del PoC pero con proyección positiva (posible infravaloración)
- Confirma con Tasa de Éxito > 50% - Mayor probabilidad estadística de éxito ✅
- Evita DIVERGENCIA ⚠️ ⚠️ - Precio sobrevalorado respecto al volumen real
- Usa el PoC como referencia - Stops o objetivos alrededor de este nivel de liquidez 🎯
- Compara Histórico vs Simulación - Si difieren mucho, el régimen de mercado está cambiando 🔄
Resumen
Using Monte Carlo simulations with default 1,000 iterations, it projects future price scenarios based on historical trends and volatility, applying a geometric Brownian motion model. This generates expected price trajectories with confidence bands (±1 standard deviation), estimating probabilities of success, risk-adjusted returns (Sharpe ratio), and potential target levels.
The combined analysis produces contextual signals such as Bullish, Bearish, Opportunity, and Divergence, based on price relation to PoC and projection direction. It supports various markets including Forex, stocks, commodities, indices, and cryptocurrencies, adjusting parameters like trading days accordingly.
Key configurable settings include analysis period, profile resolution, simulation count, and risk-free rate. Visual elements on the chart display volume profiles, PoC lines, expected value projections, and confidence intervals. The tool is designed for probabilistic market assessment and trade confirmation rather than direct buy/sell signals.


![Logotipo de "[Hamster-Coder] Moving Average"](https://cdn.ctrader.com/image/webp/1bd952ad-57d2-4db2-9b49-b01be0b048b8_30113)


