ADX advanced
Indicador
Versión 1.0, Apr 2026
Windows, Mac
4.3
Valoraciones: 3
Descripción
Sistema Avanzado de Nube y Momentum ADX
El Índice Direccional Promedio estándar (ADX) es una herramienta poderosa, pero seamos honestos: mirar tres líneas que se cruzan (+DI, -DI y ADX) es desordenado, confuso y cansa la vista.
El Indicador Avanzado ADX moderniza completamente esta herramienta clásica. Transforma las líneas caóticas en una potencia visual clara que te dice exactamente QUIÉN tiene el control (Toros vs. Osos) y QUÉ TAN FUERTE es la tendencia, todo de un solo vistazo.
Características clave
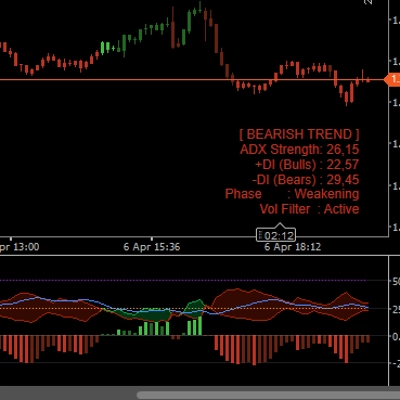
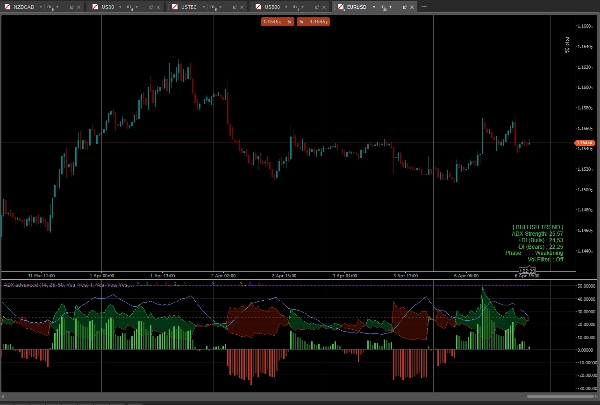
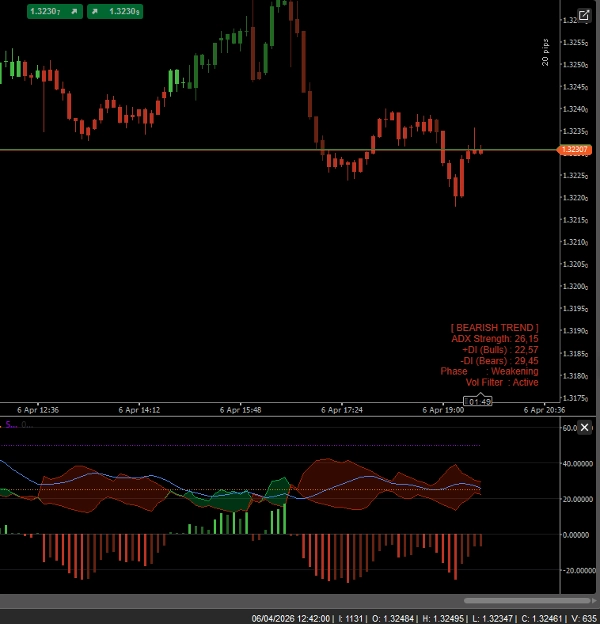
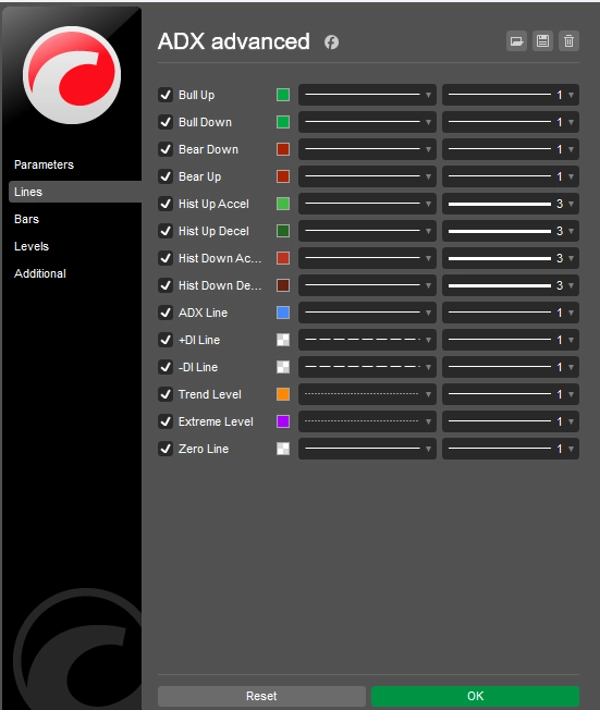
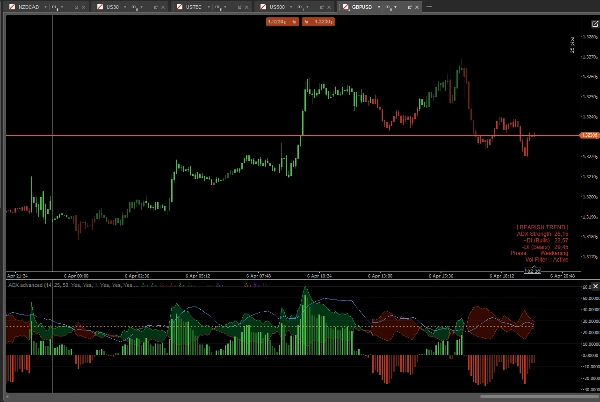
- Nubes Direccionales (Nube DI): En lugar de líneas que se cruzan, el espacio entre +DI y -DI se llena con una nube de color dinámica. Nube Verde = Toros en control. Nube Roja = Osos en control.
- Histograma de Momentum: Un histograma personalizado en la parte inferior del indicador mide la distancia exacta entre +DI y -DI. Presenta colores de aceleración/desaceleración, permitiéndote detectar el momentum que se desvanece antes de que la tendencia realmente se revierta.
- Coloreado Inteligente de Barras (Paintbars): ¡El indicador pinta directamente tus velas de precio según la fuerza de la tendencia!
-
- Verde/Rojo Brillante: Tendencia Fuerte (ADX > 25 y alineación +DI/-DI)
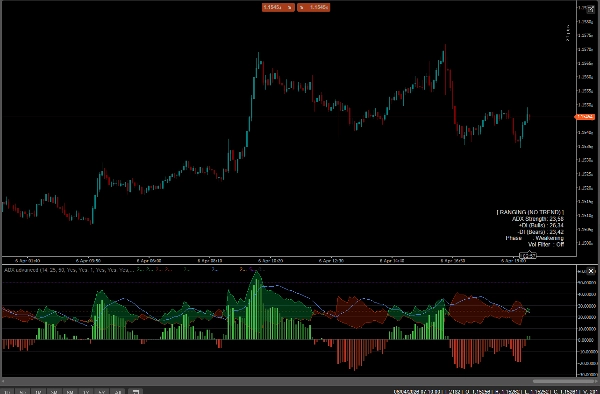
- Verde/Rojo Oscuro: Tendencia Débil / Rango (ADX < 25)
- Púrpura/Magenta: Tendencia Extremadamente Sobreextendida (ADX > 50) - ¡Prepárate para una corrección!
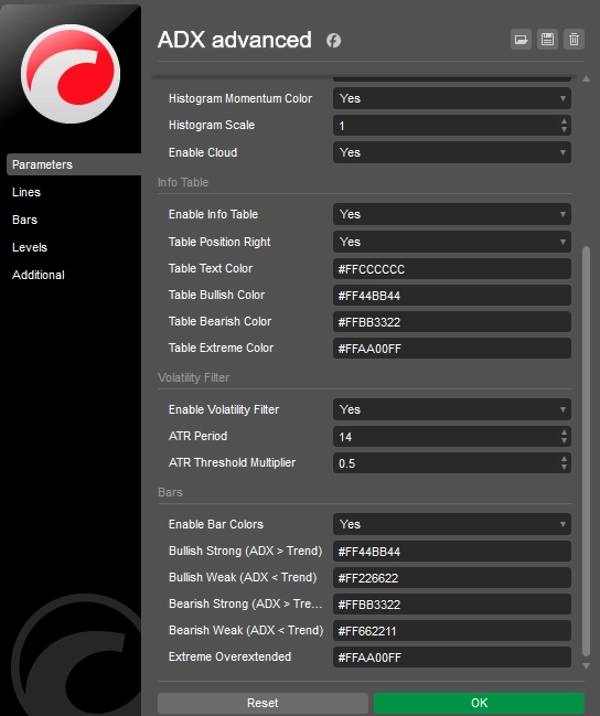
- Panel de Información en el Gráfico: Un panel elegante y no intrusivo muestra en tiempo real el Estado Actual del Mercado (Tendencia, Rango, Extremo), la Fuerza del ADX y la Fase de Momentum.
- Filtro de Volatilidad Incorporado (ATR): Filtro ATR opcional que atenúa las velas y barras del histograma cuando el mercado está completamente plano, evitando que operes en rangos laterales.
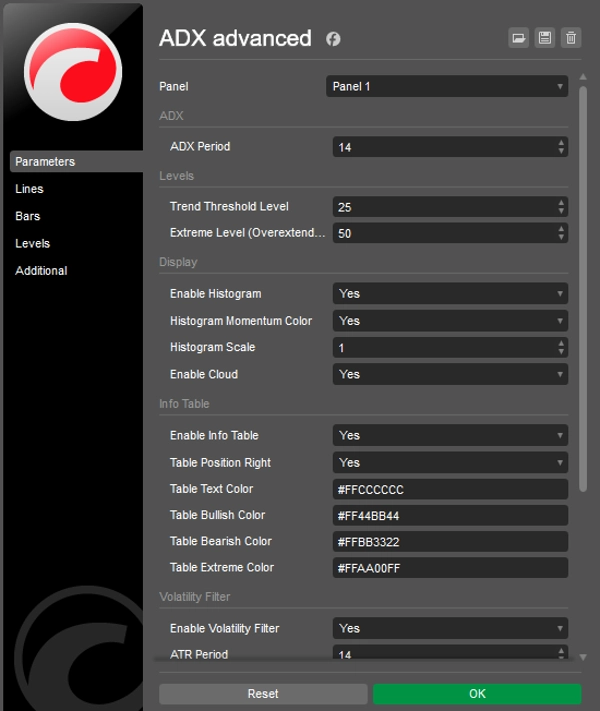
- Totalmente Personalizable: Cambia colores, umbrales (nivel de Tendencia 25, nivel Extremo 50) y la escala del histograma para adaptarlo a tu estilo personal de trading y tema del gráfico.
¿Cómo usarlo?
- Espera a que la línea azul del ADX cruce por encima del umbral 25 (la tendencia está activa).
- Mira la Nube y el Histograma para confirmar la dirección (Verde para Largo, Rojo para Corto).
- Opera los rompimientos y sigue la tendencia mientras las velas estén pintadas con colores "Fuertes".
- Toma ganancias o ajusta stops cuando la línea ADX cruce el nivel Extremo 50 (las velas se vuelven púrpuras).
Resumen
Perfil del indicador
Valoraciones de clientes
4.3
Valoraciones: 3
5 | 33 % | |
4 | 67 % | |
3 | 0 % | |
2 | 0 % | |
1 | 0 % |
Valoraciones de clientes
April 16, 2026
April 12, 2026
Conversación
Preguntas frecuentes
BTCUSD
Forex
Signal
Indices
EURUSD
Commodities
GBPUSD
NZDUSD
Prop
XAUUSD
NAS100
ATR
USDJPY
Los productos disponibles a través de cTrader Store, incluidos bots, indicadores y plugins para operar, son proporcionados por desarrolladores de terceros y están disponibles únicamente con fines informativos y de acceso técnico. cTrader Store no es un bróker, por lo que no proporciona asesoramiento de inversión, recomendaciones personales ni ninguna garantía de rentabilidad futura.


![Logotipo de "High-Low Divergence [Iridio Capital]"](https://cdn.ctrader.com/image/webp/443c4661-7abb-40f1-842f-4b6ec560649b_40914)


Precio
24
Ventas
677
Instalaciones gratis