present
Inscrivez-vous et bénéficiez d'une remise de 50 $ sur votre premier achat
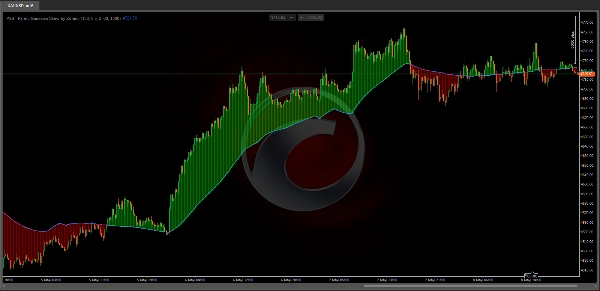
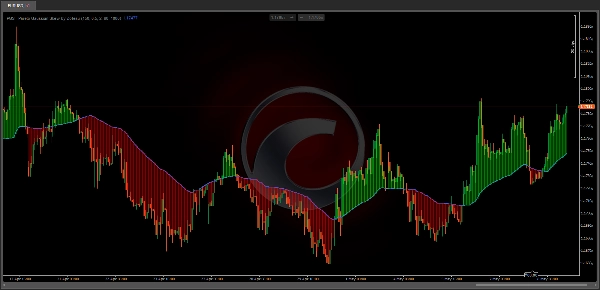
Trading product for PGS - Pareto Gaussian Skew by Zofesu Indicateur EMA Supertrend, image 1
PGS - Pareto Gaussian Skew by Zofesu
Indicateur
Version 1.0, May 2026
Windows, Mac
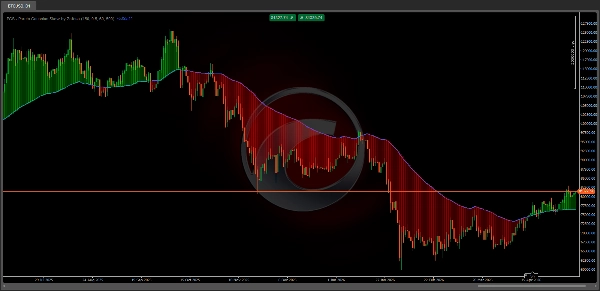
Trading product for PGS - Pareto Gaussian Skew by Zofesu Indicateur EMA Supertrend, image 2
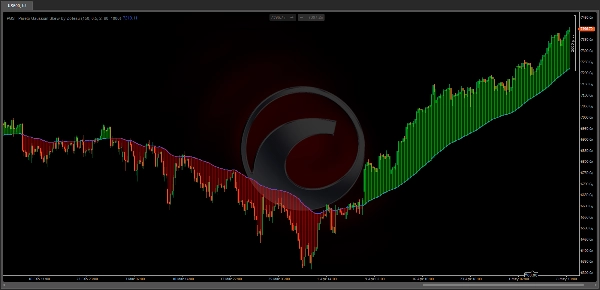
Trading product for PGS - Pareto Gaussian Skew by Zofesu Indicateur EMA Supertrend, image 3
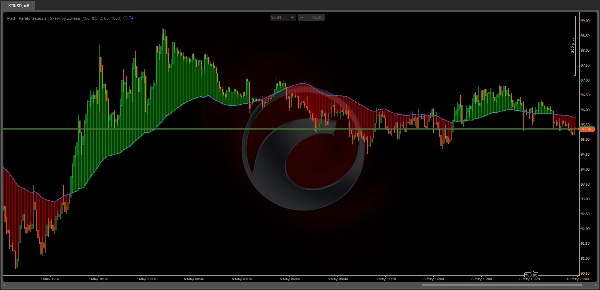
Trading product for PGS - Pareto Gaussian Skew by Zofesu Indicateur EMA Supertrend, image 4
Trading product for PGS - Pareto Gaussian Skew by Zofesu Indicateur EMA Supertrend, image 5
Trading product for PGS - Pareto Gaussian Skew by Zofesu Indicateur EMA Supertrend, image 6
Depuis le 01/12/2025
280
Installations gratuites

Description

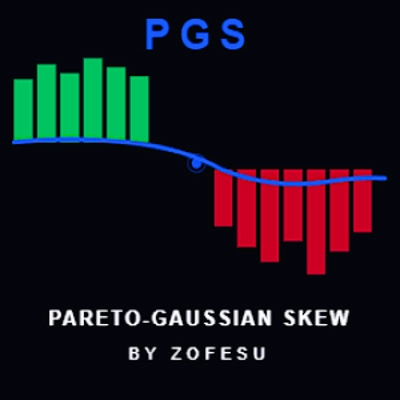
📊 PGS — Pareto-Gaussian Skew by Zofesu — Institutional Gravity Line & Tension Cloud. PGS is a precision overlay indicator built on two mathematical principles: the Gaussian distribution and the Pareto 80/20 rule. It identifies the invisible gravitational center of price — filtering out noise and focusing only on the 20% of moves that drive 80% of the trend.

⚙ HOW IT WORKS The indicator calculates a dynamic baseline (SMA) and standard deviation over a configurable lookback window. Only price moves that exceed one standard deviation are considered statistically significant — these represent institutional displacement, not random noise. The Pareto Skew Factor amplifies these extreme moves and feeds them into an EMA smoother, producing a stable gravity line that adapts to market structure. The Tension Cloud fills the space between price and the gravity line: Green cloud (price > PGS line) — price is above gravity, bullish bias Red cloud (price < PGS line) — price is below gravity, bearish bias The wider the cloud, the more extended price is from its statistical center — a potential reversion zone.

🔑 KEY FEATURES
✅ Pareto-Gaussian gravity line — filters noise, reacts only to institutional moves
✅ Dynamic Tension Cloud — visualizes distance between price and gravity center
✅ Configurable Skew Factor — control sensitivity to extreme price displacement
✅ Adjustable lookback (Smith's Memory) — 20 to 500 bars
✅ Custom cloud colors and opacity — full visual control
✅ Max Cloud Bars limit — performance-optimized rendering
✅ Lightweight C# — no performance impact

📚 HOW TO USE

  1. Add PGS to any chart and timeframe
  2. Watch the PGS blue line — this is your gravity center
  3. Green cloud = price above gravity → look for long setups or trend continuation
  4. Red cloud = price below gravity → look for short setups or trend continuation
  5. Wide cloud = price is extended → potential mean reversion zone, reduce position size or wait
  6. Price crossing the PGS line = gravity shift → potential trend change
  7. Use in confluence with S/R levels, VWAP, or volume signals

Works on any TimeFrame and Asset: Indices (NAS100, SPX500), Forex, Gold, Crypto

🔗 PARAMETERS

  • Smith's Memory (Lookback) — statistical window for SMA and StdDev calculation (default 150, range 20–500)
  • Pareto Skew Factor — weight of extreme moves in gravity calculation (default 0.5, range 0.1–1.0)
  • PGS line thickness can be adjusted via right-click → Format on the indicator or Properties → lines (default 2)
  • Cloud Opacity (0–200) — transparency of the Tension Cloud (default 60, 0=Off)
  • Max Cloud Bars — maximum number of bars rendered for the cloud (default 500)
  • Bull Cloud Color — color when price is above gravity (default green)
  • Bear Cloud Color — color when price is below gravity (default red)

📝 NOTES

  • Higher Skew Factor (0.8–1.0) = gravity line reacts more aggressively to institutional moves
  • Lower Skew Factor (0.1–0.3) = smoother, more conservative gravity line
  • Higher Lookback = slower, macro-level gravity center
  • Lower Lookback = faster, more reactive to recent price action
  • Max Cloud Bars upper limit is 2000. Values above 1000 may impact performance. On lower timeframes (M5 and below) use 300 or less.

⚠️ DISCLAIMER Trading financial instruments involves substantial risk of loss. Past performance of any indicator or strategy does not guarantee future results. This tool is provided for informational and educational purposes only. Always use proper risk management and never risk more than you can afford to lose. The author is not responsible for any trading losses incurred through the use of this indicator.

Résumé

Profil de l'indicateur
Catégorie de l'indicateur
Structure du marché (SMC)
Type de résultat
Visualisation
Exigences en matière de données
Barres seulement
Signaux pris en charge
Puissance de la tendance
Atteinte du niveau
Dépassement de niveau
Inversion

Discussion

Avis clients

0.0
Avis : 0
Avis clients
Il n'y a pas encore d'avis sur ce produit. Vous l'avez déjà essayé ? Soyez le premier à en parler aux autres !

Questions fréquentes

EMA
Supertrend
Key Levels
MSS
Volume
Market Structure
VWAP
Les produits disponibles sur cTrader Store, notamment les bots de trading, les indicateurs et les plug-ins, sont fournis par des développeurs tiers et mis à disposition à titre informatif et à des fins d'accès technique uniquement. cTrader Store n'est pas un courtier et ne fournit aucun conseil en investissement, aucune recommandation personnelle ni aucune garantie quant aux performances futures.

Plus de cet auteur

Indicateur
VWAP
Forex
+7
VWAP + Swing Liquidity + SFP Signals — detects liquidity sweeps with color-coded alerts.
Indicateur
SMC
Forex
+5
Fear & Greed engine — detects institutional overheating with BB + Percentile signals.

Vous pourriez aussi aimer

Indicateur
Forex
Crypto
+3
Day of Week Indicator for cTrader
Indicateur
ATR
MSS
+5
Advanced market structure and institutional cycle mapper with visual reference cards and entry alerts
Indicateur
Forex
BTCUSD
+5
Trend analysis, automatic analysis, position, swingtrader, scalper
Indicateur
ATR
VWAP
+5
Candle Volume Profile for Crypto
Indicateur
EMA
RSI
+5
MACD Colour Histogram with 11 Moving Average Types, Multi-timeframe confirmation and Sound Signal Alert.
Indicateur
ADX
ATR
+2
GOLD SENTINEL v1.0 - A CANDLE-COLORING INDICATOR FOR GOLD.
Indicateur
ATR
RSI
+4
RSI bands drawn on price, confluence-scored BUY/SELL signals, an ATR stop with three targets
Indicateur
BOS
EMA
+5
VWAP Bands indicator with 3 standard deviation levels, buy/sell zones, and a draggable ON/OFF button to toggle the entir
Indicateur
MACD
Forex
+6
Auto Signal BUY SELL is a professional decision-making tool designed to help you follow the trend and capture high-proba
Indicateur
Supply & Demand
Support & Resistance
Trade With Smile Indicator is a professional trading indicator designed to help traders identify potential market trends
Indicateur
Forex
BTCUSD
+10
🎯Smart Signals : Auto Buy/Sell alerts with dynamic TP/SL algorithm. 💡
Indicateur
SMC
VWAP
+16
It calculates Anchored VWAP and StdDev bands from a user-defined start date for cTrader charts.
Indicateur
This indicator can be used to: change color, shape size, position, change font, increase or decrease, and other function
Indicateur
SMC
NAS100
+5
Rolling Volume Profile MTF with 24H, 7D, 30D profiles and a precise NY Open marker.
Indicateur
SMC
Forex
+5
MMXM Structure by LudwigICT – Professional Market Structure Mapping Tool
Indicateur
ATR
RSI
+5
Delta RSI Candle Pro, the indicator that transforms ordinary candlesticks into powerful momentum visualizers.
Indicateur
Doji
Wedge
+5
Angora Pattern Recognition is a cTrader indicator that finds, draws and tracks classic chart patterns automatically.
Indicateur
SMC
Prop
+14
Right-anchored cTrader Volume Profile with VAH/VAL/POC, LVZ, top volume+EMA, themes, and fast, readable visuals.

Prix

Depuis le 01/12/2025
280
Installations gratuites