
Beschreibung
Das Support & Resistance Toolkit ist ein umfassender Indikator zur Analyse der Marktstruktur, der Tradern dabei hilft, hochwahrscheinliche Unterstützungs- und Widerstandsbereiche in Charts zu identifizieren. Durch die Kombination mehrerer fortschrittlicher Pivot-Punkt-Erkennungsalgorithmen mit adaptiven Volatilitätszonen, institutionellen Geldflussfiltern und Liquiditätsanalysen verwandelt dieses Toolkit traditionelle Unterstützungs- und Widerstandslinien in ein datengetriebenes strategisches Werkzeug.
Erkennung
Dieses Toolkit umfasst vier fortschrittliche Erkennungsmethoden, die auf verschiedene Handelsstile und Marktumgebungen abgestimmt sind:
- Pivots: Der klassische Ansatz zur Erkennung von Unterstützung und Widerstand, der konfigurierbare linke und rechte Rückblickstärken verwendet, um lokale Hochs und Tiefs zu erkennen.
- Donchian: Ein leistungsstarker Zustandsautomaten-Algorithmus, der wechselnde Schwungstrukturen erkennt. Anstatt eine feste Verzögerung zu verwenden, bestätigt er Extreme, wenn der Markt den Richtungszustand ändert.
- CSID: Eine momentumgetriebene Erkennungsmethode, die strukturelle Wendepunkte basierend auf aufeinanderfolgenden bullischen oder bärischen Kerzen identifiziert und starke Trendinitiierungszonen hervorhebt.
- ZigZag: Ein volatilitätsbasierter Algorithmus, der kleinere Preisschwankungen herausfiltert, indem er eine Mindestprozentabweichung verlangt, bevor ein Schwung erkannt wird.
Zone / Niveau
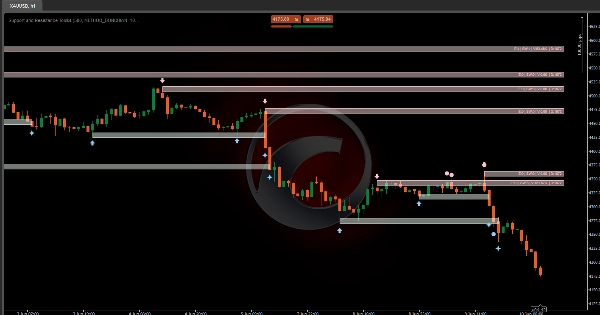
Im Gegensatz zu herkömmlichen Indikatoren, die einfach feste Linien zeichnen, behandelt dieses Tool Unterstützungs- und Widerstandsniveaus als dynamische Preiszonen basierend auf den folgenden Merkmalen:
- Zonentiefe (ATR-Mult): Bestimmt die Dicke jeder Zone basierend auf dem Average True Range. Dies ermöglicht es den Zonen, sich automatisch an die Marktvolatilität anzupassen.
- Breakout-Puffer (ATR-Mult): Ein einzigartiger Sicherheits-Puffer, der die Zone über die Ausbruchsseite hinaus erweitert. Der Preis muss diese zusätzliche Volatilitätsschicht überschreiten, bevor der Indikator einen Ausbruch bestätigt, was Fehlalarme und Fakeouts reduziert.
Filterung & Sichtbarkeit:
- Überlappungen zusammenführen: Kombiniert sich überschneidende Zonen zu einer größeren „Super-Zone“, die den gesamten historischen Interaktionsbereich repräsentiert.
- Älteste zuerst ausblenden: Priorisiert die jüngere Marktstruktur, indem ältere Zonen bei Überlappungen ausgeblendet werden.
- Jüngste zuerst ausblenden: Bewahrt etablierte historische Strukturen, indem kleinere neue Zonen ignoriert werden, die innerhalb bestehender Bereiche erscheinen.
Niveau-Filterung ( E:Eintritte | S:Stärke | SW:Sweeps | V:Volumen | D:Dauer )
- Preis-Eintritte (E): Erfordert, dass ein Niveau eine bestimmte Anzahl von Retests durchläuft, bevor es im Chart angezeigt wird.
- Sweeps (SW): Erkennt Liquiditätsfallen, bei denen der Preis kurzzeitig ein Niveau mit einem Docht verletzt, aber innerhalb der Zone schließt.
- Gehandeltes Volumen (V): Verfolgt das gesamte gehandelte Volumen, das auftritt, während der Preis mit der Zone interagiert, und hebt die institutionelle Beteiligung hervor.
- Dauer (D): Erfordert, dass Zonen eine Mindestanzahl von Bars überdauern, bevor sie als gültige strukturelle Niveaus gelten.
Visuelle Signale
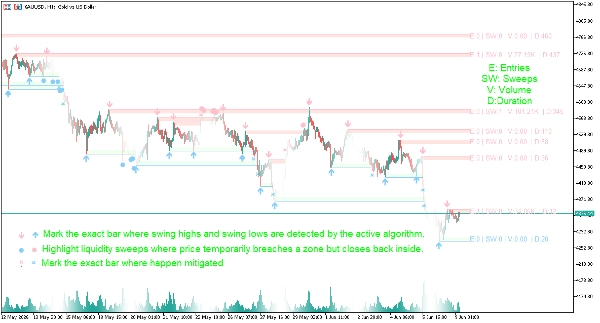
- ⬆/⬇ Pfeile: Markieren die genaue Kerze, an der Schwunghochs und Schwungtiefs vom aktiven Algorithmus erkannt werden.
- ● Große Punkte: Heben Liquiditäts-Sweeps hervor, bei denen der Preis vorübergehend eine Zone durchbricht, aber wieder innerhalb schließt.
- ✖ Kreuz: Markieren die genaue Kerze, an der Schwunghochs und Schwungtiefs migriert werden.
- Zusammenfassende Labels: Jeder Anzeigebereich verfügt über ein prägnantes Datenlabel mit den Parametern E (Eintritte), S (Stärke), SW (Sweeps), V (Volumen) und D (Dauer), das es Benutzern ermöglicht, die strukturelle Qualität schnell zu beurteilen.
Dashboard
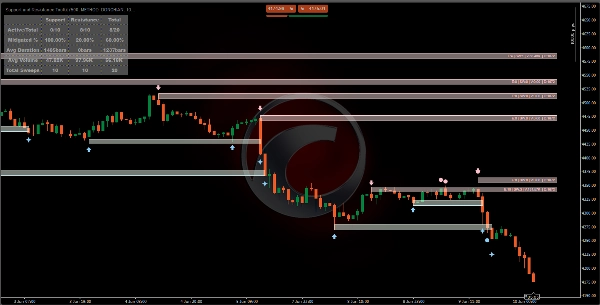
- Aktiv / Gesamt: Zeigt an, wie viele Strukturen derzeit aktiv sind im Vergleich zur historisch insgesamt erkannten Anzahl.
- Minderungs-%: Misst, wie häufig Niveaus durchbrochen oder gemindert werden, und gibt Einblick in die Zuverlässigkeit der Marktstruktur.
- Durchschnittliche Dauer: Die durchschnittliche Anzahl von Bars, die eine Unterstützungs- oder Widerstandszone überdauert, bevor sie durchbrochen wird.
- Durchschnittliches Volumen: Gibt die durchschnittliche institutionelle Beteiligung innerhalb der Zonen vor einem Ausbruch an.
- Gesamte Sweeps: Verfolgt das Liquiditätsjagdverhalten im gesamten Markt.
Indikatoreinstellungen
Erkennungseinstellungen
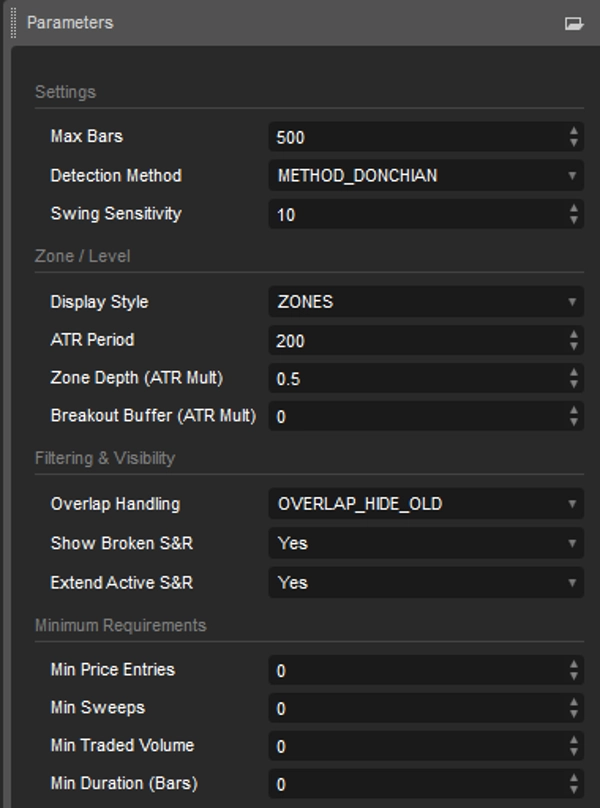
- Erkennungsmethode: Auswahl zwischen Pivots, Donchian, CSID oder ZigZag Schwungerkennungslogik.
- Schwungempfindlichkeit: Passt die erforderliche Abweichung oder Rückblicklänge an, die benötigt wird, um Schwunghochs und -tiefs zu bestätigen.
Zonen- & Niveaukonfiguration
- Anzeigestil: Umschalten zwischen präzisen horizontalen Unterstützungs- und Widerstandslinien oder ATR-basierten Zonen.
- ATR-Periode: Bestimmt den Volatilitätszeitraum, der für die Zonenkalkulation verwendet wird.
- Zonentiefe (ATR-Mult): Passt die Dicke der Unterstützungs- und Widerstandszonen an.
- Breakout-Puffer (ATR-Mult): Fügt einen Volatilitätspuffer hinzu, um falsche Ausbrüche herauszufiltern.
Chart-Sichtbarkeit & Strukturkontrolle
- Überlappungsbehandlung: Wählen Sie, wie überlappende Zonen behandelt werden (Zusammenführen, Älteste ausblenden oder Jüngste ausblenden).
- Max. aktiv (unmildert): Begrenzt die Anzahl der aktiven Unterstützungs- und Widerstandszonen, die im Chart angezeigt werden.
- Zeige gebrochene U&W: Umschalten, ob gebrochene Niveaus für die historische Analyse sichtbar bleiben.
- Aktive U&W verlängern: Projiziert aktive Niveaus in zukünftige Preisbalken.
Minimale strukturelle Anforderungen
- Min. Preis-Eintritte: Legt die erforderliche Anzahl von Retests fest, bevor ein Niveau sichtbar wird.
- Min. Sweeps: Erfordert eine bestimmte Anzahl von Liquiditäts-Sweeps, bevor die Zone angezeigt wird.
- Min. gehandeltes Volumen: Stellt sicher, dass Zonen eine Mindestschwelle institutioneller Beteiligung erfüllen.
- Min. Dauer (Bars): Erfordert, dass Niveaus für eine bestimmte Anzahl von Bars existieren, bevor sie erscheinen.
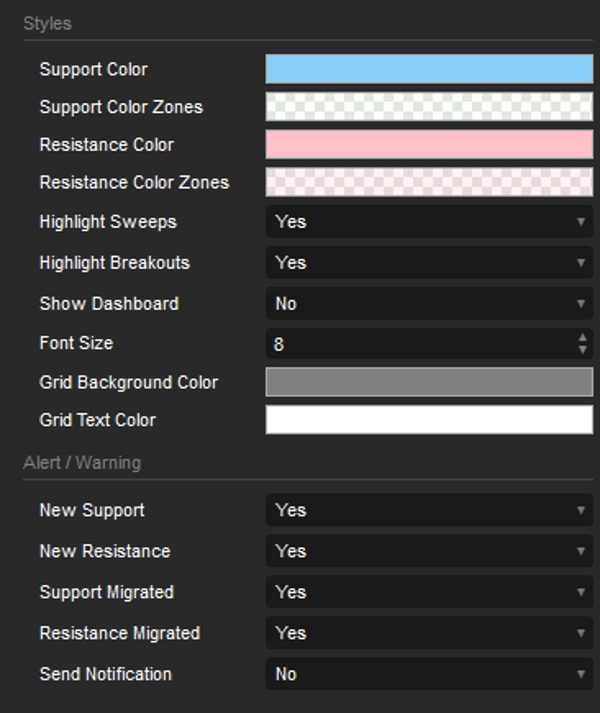
Stile und Alarm
- Stile: Passt die Farbkonfiguration der Objekte an. Dashboard ausblenden/anzeigen.
- Alarm: Schaltet Alarme ein/aus, wenn ein neuer U&W erkannt oder ein U&W migriert wird.
Zusammenfassung
Unlike traditional fixed lines, this tool defines support and resistance as dynamic price zones, with thickness and breakout buffers scaled by Average True Range (ATR) to adapt to market volatility. It features zone merging and selective visibility options to manage overlapping zones, prioritizing recent or historical structures as needed.
The indicator applies multiple filters based on price re-tests, liquidity sweeps, traded volume, and zone duration to validate structural levels. Visual signals include arrows marking swing points, dots highlighting liquidity sweeps, crosses for migrated swings, and summary labels displaying entries, strength, sweeps, volume, and duration metrics.
A dashboard provides real-time statistics on active versus total structures, mitigation percentages, average zone duration, volume, and liquidity sweep counts. Users can customize detection methods, sensitivity, zone display styles, ATR parameters, overlap handling, and structural requirements. Alerts can be enabled for new or migrated support and resistance levels.
This toolkit supports detailed market structure analysis with data-driven, volatility-adjusted zones to assist traders in identifying key price areas.


