
설명
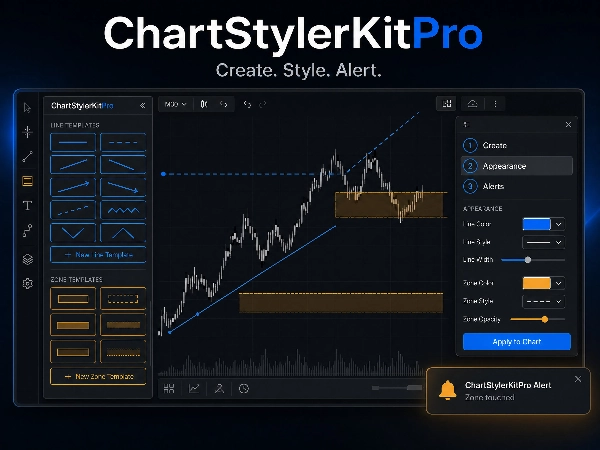
ChartStyleKitPro 는 그래픽 객체(사각형 및 추세선)의 관리, 스타일링 및 조직을 위한 중앙 집중식 제어판으로 설계된 cTrader 지표입니다. 이 지표의 목적은 차트에 있는 각 도형을 개별적으로 스타일링하는 수동적이고 반복적인 작업을 제거하고, 대량 작업, 재사용 가능한 템플릿 및 지능형 자동 텍스트를 제공하는 것입니다.
이 지표는 오버레이로 작동하며 신호를 생성하거나 기술 지표를 계산하지 않습니다. 그 가치는 생산성과 차트 분석의 시각적 일관성에 있습니다.
주요 기능
1. 인터랙티브 제어판
이름이 지정된 템플릿 만들기
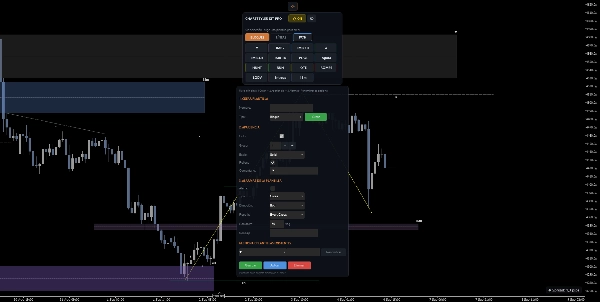
톱니바퀴 아이콘을 열고 1. CREATE TEMPLATE를 찾으세요. 이 섹션에서 템플릿의 초기 이름을 입력하고 Block 또는 Line 을 선택한 후 Create를 클릭하세요. 따라서 템플릿은 이 첫 단계에서 이름이 부여됩니다.
새 템플릿은 안전하고 편집 가능한 값으로 시작합니다: 기본 색상, 두께, 실선 스타일, 유형에 따른 채우기 및 알림 비활성화. 생성은 자동으로 객체를 그리지 않고 먼저 템플릿을 등록하여 그리드에서 검토하고 사용할 수 있도록 합니다.
2. 외관 구성
재사용하려는 시각적 속성을 선택하세요. 변경 사항을 저장하려면 Save를 클릭하세요.
3. 자동 50% 선
그려진 각 사각형에 대해, 지표는 사각형의 상단 및 하단 가격 사이의 중간 지점(50%)에 수평선을 자동으로 계산하고 그립니다.
- 선은 기본적으로 점선입니다(구성 가능)
- 왼쪽 가장자리에 "50%" 라벨이 포함되어 있습니다
- 사각형을 이동하거나 크기를 조정하면 실시간으로 업데이트됩니다
- 부모 사각형과 함께 숨기기/보이기(하나의 객체처럼 동작)
일반적인 사용: 가격 범위 내 균형 영역, 공급/수요 영역 내 결정 수준.
3. Automatic 50% line
For each rectangle drawn, the indicator automatically calculates and draws a horizontal line at the midpoint (50%) between the upper and lower price of the rectangle.
- The line is dotted by default (configurable)
- Includes a "50%" label on the left edge
- Updates in real time if you move or resize the rectangle
- Hides/shows together with the parent rectangle (behaving as a single object)
- Typical use: equilibrium zones within a price range, decision levels within supply/demand zones.
4. 사각형 내 자동 텍스트
사각형에 Comment가 있으면, 지표는 이를 사각형 내부에 보이는 텍스트로 렌더링합니다.
- 위치 자동 계산: 구성 가능한 여백과 함께 오른쪽 상단 모서리
- 수직 여백은 핍 단위(상단 가장자리로부터)
- 수평 여백은 시간 단위(오른쪽 가장자리로부터)
- 창 크기에 맞게 조정 가능한 글꼴 크기
- 색상, 굵게 및 글꼴 구성 가능
- 일반적인 사용: "공급 영역", "매수 영역", "FVG", "주문 블록"과 같은 라벨을 추가 수동 텍스트 없이 영역에 직접 표시
5. 스타일 템플릿
객체의 시각적 구성을 저장하고 재사용하기 위한 완전한 CRUD 시스템(생성, 읽기, 업데이트, 삭제).
각 템플릿이 저장하는 항목:
- 색상
- 두께
- 선 스타일(실선, 점선 등)
- 채우기(사각형용)
- 가시성 상태
- 잠금 상태
- 코멘트
사용 가능한 작업:
작업설명
저장
선택한 객체에서 스타일을 추출하여 사용자 지정 이름으로 저장합니다. 선택적 코멘트 필드 포함.
적용
저장된 템플릿을 불러와 선택한 모든 객체에 적용합니다.
업데이트
선택한 객체의 현재 스타일로 기존 템플릿을 덮어씁니다.
이름 변경
기존 템플릿의 이름을 변경합니다.
삭제
저장소에서 템플릿을 제거합니다.
따뜻한 톤, 긴 세션 동안 눈의 피로 감소
강조 색상은 구성 가능하며(기본값 #4DA6FF 파란색), 토글 버튼은 활성/비활성 색상을 자동으로 계산하여 좋은 대비를 보장합니다.
요약
Key features include:
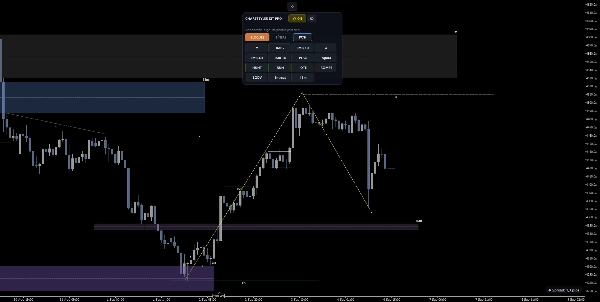
- Interactive control panel: When selecting graphical objects, a floating panel appears showing the count and type of selected items, with buttons to lock/unlock, hide/show, toggle fill for rectangles, hide/show all objects, and manage style templates. Contextual help guides available actions.
- Automatic 50% line: For each rectangle, the indicator draws a horizontal line at the midpoint between its top and bottom prices, updating in real time with movement or resizing. This line includes a "50%" label and hides/shows with its parent rectangle.
- Automatic text rendering: Comments attached to rectangles or trend lines are displayed as text within or above the objects, with configurable position, margins, font size, and style.
- Style templates: A full CRUD system allows saving, applying, updating, renaming, and deleting visual style templates that store color, thickness, line style, fill, visibility, lock state, and comments for objects.
- Four interface color themes: Dark, Light, Midnight, and Warm, each with configurable accent colors and automatic toggle button contrast.
This tool supports efficient management of chart annotations commonly used in market structure and Smart Money Concepts analysis, including supply/demand zones, order blocks, fair value gaps, and support/resistance levels.
상담
고객 리뷰
자주 묻는 질문(FAQ)






가격
