
Stochastic and RSI Oscillator Indicators
Use Stochastic and RSI oscillator indicators to measure momentum, overbought and oversold zones, and possible forex reversals. These tools support timing decisions, confirmation checks and cleaner entry planning in cTrader.
工具
工具比较
常见问答


工具比较
产品 | 评价 | 下载 | 销售 | 价格 | 兼容平台 |
|---|---|---|---|---|---|
StochasticRSI | 5.0 (2) | 1.25K | — | 免费 | Windows 版、Mac 版 |
VegaXLR - RSI and StochRSI Alerts | 5.0 (3) | — | 18 | $10 起 | Windows 版、Mac 版 |
Stochastic RSI Indicator | 5.0 (1) | 263 | — | 免费 | Windows 版、Mac 版 |
Divergence Suite VPro | 4.5 (4) | — | 3 | $25 | Windows 版、Mac 版 |
Final Stochastic Oscillator | 4.0 (1) | 236 | — | 免费 | Windows 版、Mac 版 |
Stochastic Momentum Index | 4.3 (4) | — | 1 | $19 | Windows 版、Mac 版 |
Stochastic confluence | 4.0 (1) | 124 | — | 免费 | Windows 版、Mac 版 |
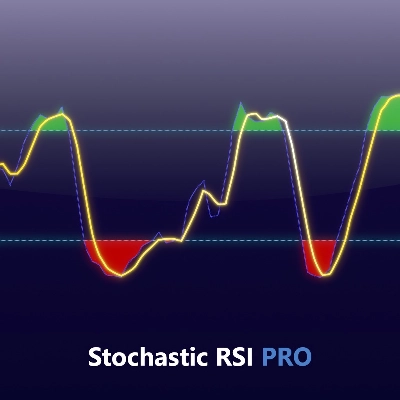
Stochastic RSI PRO | 4.7 (6) | — | 1 | $28 | Windows 版、Mac 版 |
SMC_Guardian_Signal_Panel | — | 25 | — | 免费 | Windows 版、Mac 版 |
Stochastique RE | 4.8 (4) | — | — | $19 | Windows 版、Mac 版 |
FFT_SDE_Visual Engine | 4.7 (3) | — | — | $20 起 | Windows 版、Mac 版 |
常见问答
RSI compares average gains with average losses and scales the result from zero to a hundred, while a stochastic oscillator locates the close within the recent high-low range. Both are bounded momentum gauges, so readings near their edges are read as stretched.
The %K line places the latest close within the highest high and lowest low of the lookback, and %D is a moving average of the smoothed %K. Crossings of the two near the upper or lower zone are a common reading, and the slowing setting controls how much %K is smoothed first.
Persistent buying keeps closes near the top of the range and gains above losses, so both gauges can stay in their upper zones for many bars. The classic thresholds are seventy for RSI and eighty for stochastic, and selling against them in a trend is a common false signal.
The oscillator alone does not: it only plots the line and its levels, and Store versions open only in cTrader's Windows and Mac editions. Turning a level rule into orders takes a cBot, such as one adapted from the RSI sample, which you backtest and start yourself under your own settings.
Often it is, since the core formulas are standard; paid versions may add multi-timeframe views, divergence marks or alerts, and trials let you compare. Either way, scroll back over varied symbols and periods to see how often extremes preceded reversals and how often trends simply continued.