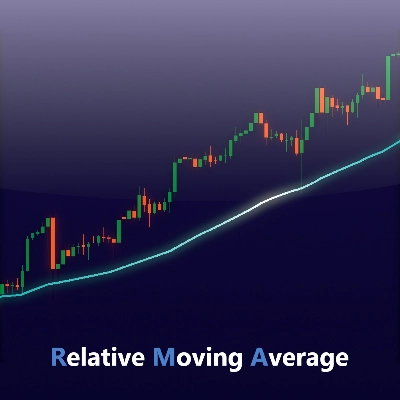
Présentation de l’indicateur Relative Moving Average (RMA), désormais disponible pour cTrader !
Le Relative Moving Average (RMA) — également connu sous le nom de Smoothed Moving Average (SMMA) — est un type de moyenne mobile qui vise à réduire le décalage tout en maintenant la fluidité de la courbe. C’est la même formule utilisée par la fonction intégrée “RMA” de TradingView, largement utilisée dans des indicateurs populaires comme le Relative Strength Index (RSI).
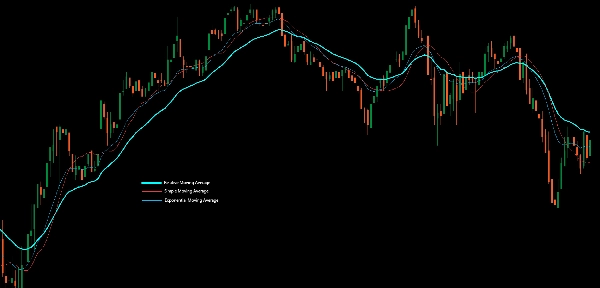
Le RMA est conçu pour trouver un équilibre entre réactivité et stabilité. Il se met à jour plus en douceur qu’une Exponential Moving Average (EMA) mais réagit plus rapidement aux variations de prix qu’une Simple Moving Average (SMA).
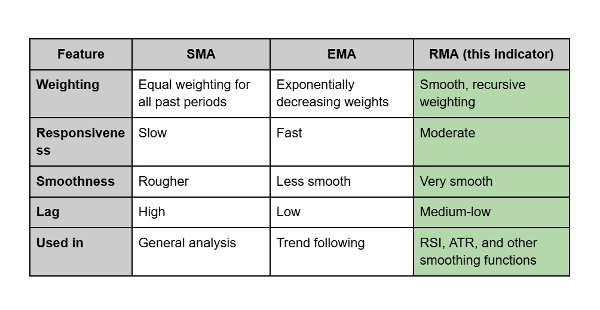
Différences :
- La SMA moyenne tous les prix de manière égale, ce qui entraîne un décalage et une instabilité.
- L’EMA donne plus de poids aux prix récents, la rendant très réactive mais parfois bruyante.
- Le RMA, en revanche, combine les avantages des deux : il lisse la volatilité tout en conservant des réactions opportunes aux variations de prix.
Utilisation pratique :
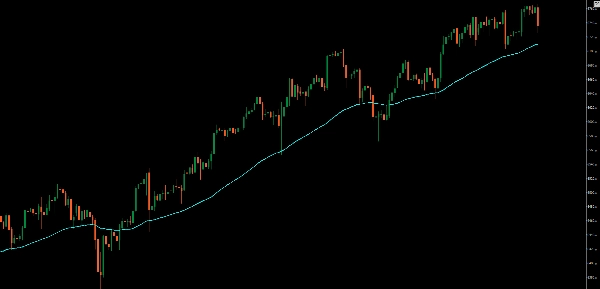
Les traders utilisent souvent le RMA comme ligne de tendance plus lisse ou dans le cadre d’indicateurs de momentum. Il est particulièrement efficace lorsque vous souhaitez filtrer le bruit sans introduire de décalage significatif — idéal pour confirmer des tendances à plus long terme ou pour soutenir des analyses de surachat/survente.


![Logo de "[Hamster-Coder] Moving Average MTF"](https://cdn.ctrader.com/image/webp/b11b98b1-194d-4b8e-b00e-d611826ad159_31226)


