说明
🎯 多时间框架波动率情报
别再错过波动率突破——同时查看所有时间框架
大多数波动率指标只显示一个视角。我们的 多时间框架滚动波动率指标 为您提供短期(7)、中期(21)和长期(63)周期的完整图景——并带有 内置交易信号,准确告诉您何时采取行动。
⚡ 为什么多时间框架波动率改变一切
单一时间框架 vs 我们的多时间框架方法:
- ❌ 单一周期:只见树木,不见森林
- ✅ 三个周期:带有上下文的完整波动率全景
真实交易场景:
- 短期波动激增 而长期平静 → 暂时噪音(忽略)
- 所有时间框架上升 → 真正的市场状态变化(行动)
- 短期平静 而长期混乱 → 假象平静(谨慎)
🎯 专业功能
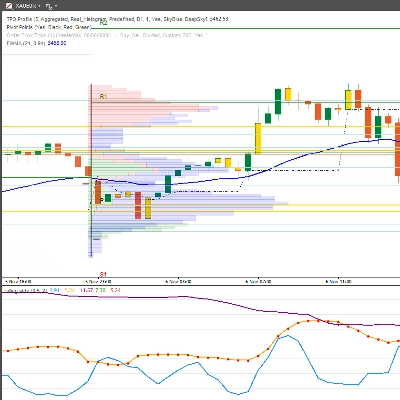
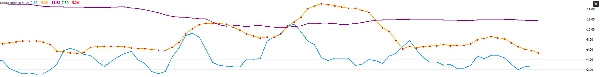
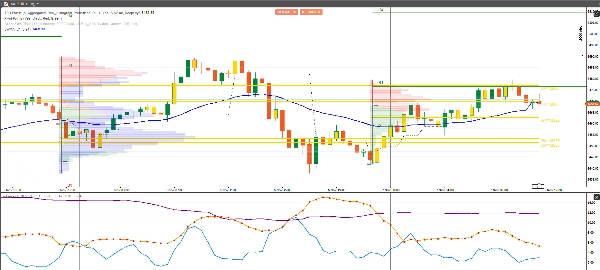
✨ 三重时间框架可视化
- StdDev 7:捕捉即时波动变化(盘中)
- StdDev 21:中期波动率(波段交易)
- StdDev 63:长期波动率背景(持仓交易)
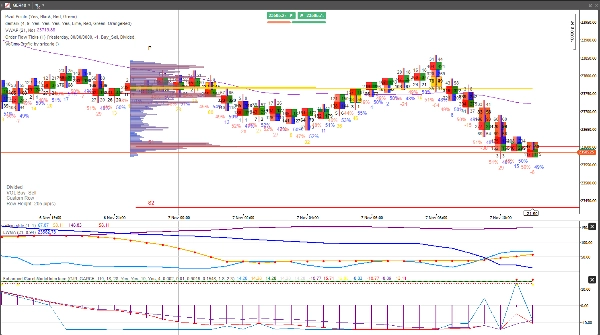
🚦 自动交易信号
- 绿色买入箭头:波动率压缩机会
- 红色卖出箭头:波动率扩张警告
- 智能阈值:可配置买卖水平
📊 高级波动率分析
- 波动率交叉:StdDev线交叉 = 市场状态变化
- 均值回归信号:波动率回归均值
- 激增检测:极端波动事件
💡 适合以下交易风格:
🎯 波动率突破交易者
- 在爆发性走势前低波动率时入场
- 在高波动率反转前退出
- 使用三重确认精准把握入场时机
📈 均值回归交易者
- 自信地对冲波动率极端
- 识别市场过度延伸状态
- 将波动率用作逆向指标
🛡 风险规避交易者
- 完全避免高波动率时期
- 仅在平稳、可预测的市场中交易
- 将波动率作为仓位大小指导
📊 期权交易者
- 高波动率时卖出时间价值
- 波动率压缩时买入期权
- 隐含波动率与历史波动率的错价分析
内置智能信号:
- ✅ 买入时机:波动率低于阈值或跌破移动平均线
- ✅ 卖出时机:波动率高于阈值或突破移动平均线
📈 您将获得:
✅ 三重时间框架可视化 - 不再猜测波动率背景
✅ 自动买卖信号 - 在最佳点位显示清晰箭头
✅ 波动率状态检测 - 了解市场何时平静或混乱
✅ 可定制阈值 - 适应任何交易风格或资产
✅ 专业颜色编码 - 即时视觉理解
💰 特别推出价:$50
(原价:$100)
价值明细:
- StdDev 7 指标:价值$29
- StdDev 21 指标:价值$29
- StdDev 63 指标:价值$29
- 交易信号:价值$49
- 总价值:$136
- 您的价格:$50(节省35%)
包含:完整指标 + 终身更新 + 优先支持
30天退款保证 - 如果这不能改善您的波动率时机,我们将全额退款。
🎁 赠品:免费波动率时机指南
购买即赠送 “多时间框架波动率精通” - 价值$39,免费赠送。
包含内容:
- 波动率压缩交易策略
- 多时间框架确认技术
- 波动期风险管理
- 真实交易案例
🚀 准备好掌握波动率时机了吗?
点击“加入购物车”,改变您观察和交易市场波动率的方式。
“我试过所有波动率指标。这种带内置信号的三重时间框架方法是我在自营交易中每天使用的。”
- Sarah Rodriguez,专业波段交易员
适合以下市场:
📊 股票与ETF
- SPY、QQQ波动率时机
- 基于波动率的板块轮动
- 财报波动率交易
💹 外汇货币对
- 主要货币对波动率分析
- 套息交易风险评估
- 突破确认
📈 商品
- 黄金波动周期
- 石油波动激增
- 农产品季节性波动
🔄 加密货币
- BTC/ETH波动率状态
- 山寨币波动机会
- 加密风险管理
总结:这不仅仅是另一个标准差指标。它是一个完整的波动率时机系统,准确显示市场即将移动的时刻。
限时推出优惠:前150份售价$89(节省$30)
“业余与专业交易的区别往往在于波动率时机。这个指标弥补了这一差距。”
立即加入购物车 → 开始像专业人士一样交易波动率


