SwingHighLowDetector
Indicateur
Version 2.2, Jan 2026
Windows, Mac
5.0
Avis : 3
Description
Ceci est un indicateur de haute précision pour trouver les oscillations.
L'utilisateur peut personnaliser cet indicateur pour envoyer des alertes ainsi que des pop-ups sur leurs graphiques et autres appareils.
Mode d'emploi :
- Attachez l'indicateur au graphique.
- Il calculera les oscillations passées et les affichera à l'écran
- Personnalisez les paramètres selon vos préférences concernant le nombre maximal d'enregistrements passés à suivre.
- Pour créer une alerte, activez l'option "Alert Allowed" pour envoyer dynamiquement une alerte à vos appareils lorsque des oscillations se forment ou sont déclenchées.
- Une autre fonctionnalité détectera si le prix a franchi des oscillations, puis supprimera cet indicateur de l'analyse. (Activez le paramètre "Remove Swept levels")
- Enfin, personnalisez le paramètre "Past Swing Days Alerts" pour recevoir des alertes pour toutes les oscillations générées au cours des N derniers jours.
Pourquoi acheter cet indicateur ?
- Pour réduire l'analyse des oscillations pour différents marchés.
- Avec l'aide de notre indicateur, vous pouvez clairement visualiser les oscillations ainsi que recevoir des alertes sur votre appareil, ce qui vous fera gagner énormément de temps.
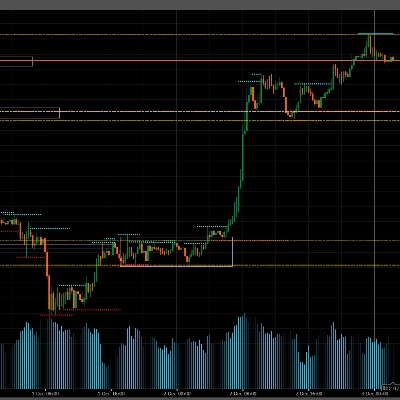
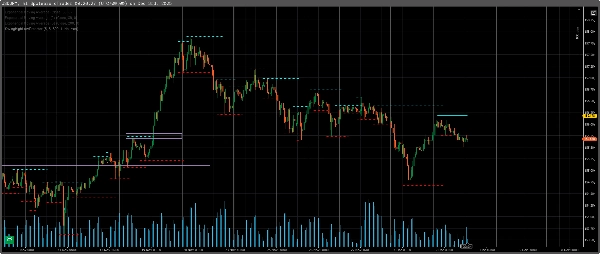
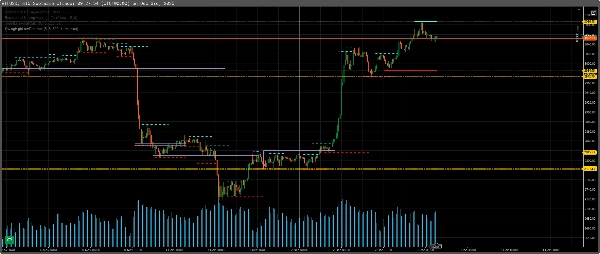
Détails graphiques généraux :
- Les lignes pointillées bleu aqua sont les plus hauts des oscillations passées
- La ligne bleue pointillée solide est le dernier plus haut d'oscillation
- Les lignes rouges pointillées sont les plus bas des oscillations passées
- La ligne rouge pointillée solide est le dernier plus bas d'oscillation
Résumé
Profil de l'indicateur
Avis clients
5.0
Avis : 3
5 | 100 % | |
4 | 0 % | |
3 | 0 % | |
2 | 0 % | |
1 | 0 % |
Avis clients
December 14, 2025
A calm trader gets value from the idea has to earn the click. Overconfidence is the real danger.
December 4, 2025
Discussion
Questions fréquentes
BTCUSD
Forex
Breakout
Indices
EURUSD
Commodities
GBPUSD
NZDUSD
Prop
Crypto
Stocks
XAUUSD
NAS100
USDJPY
Les produits disponibles sur cTrader Store, notamment les bots de trading, les indicateurs et les plug-ins, sont fournis par des développeurs tiers et mis à disposition à titre informatif et à des fins d'accès technique uniquement. cTrader Store n'est pas un courtier et ne fournit aucun conseil en investissement, aucune recommandation personnelle ni aucune garantie quant aux performances futures.


![Logo de "High-Low Divergence [Iridio Capital]"](https://cdn.ctrader.com/image/webp/443c4661-7abb-40f1-842f-4b6ec560649b_40914)


Prix
Depuis le 13/03/2025