Description
━━━━━━━━━━━━━━━━━━━━━━━━━━━━━━━━━━━━━━━━
ATR Risk Visualizer — Risque
━━━━━━━━━━━━━━━━━━━━━━━━━━━━━━━━━━━━━━━━
Visualise instantanément vos niveaux de Stop Loss et Take Profit basés sur l'ATR — avec une cartographie complète des multiples R (1R à 5R) et des étiquettes de pips — pour que vous négociiez toujours avec un risque défini avant d'entrer en position.
─────────────────────────────
FONCTIONNALITÉS CLÉS
► Stop Loss basé sur l'ATR — distance SL calculée comme ATR × multiplicateur configurable (par défaut 1,5×)
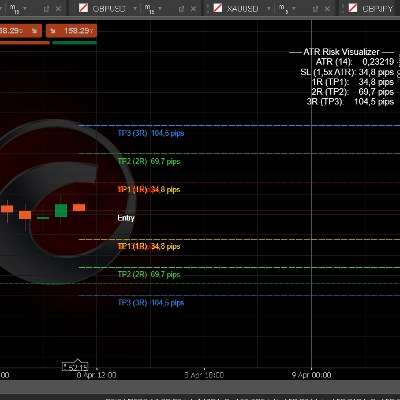
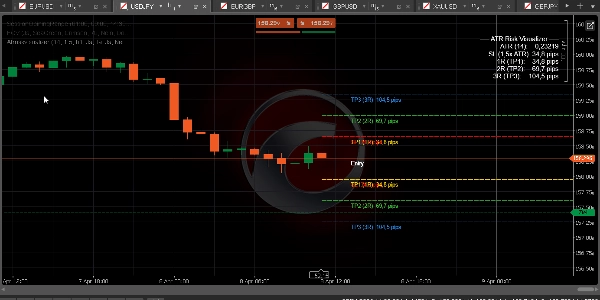
► Take Profits à multiples R — TP1 (1R), TP2 (2R), TP3 (3R), TP4 (4R), TP5 (5R) tracés automatiquement à partir du prix actuel
► Étiquettes de pips à chaque niveau — voyez la distance exacte en pips pour le SL et chaque TP d'un coup d'œil
► Niveaux Long et Short simultanément — ou basculez en mode Long uniquement ou Short uniquement
► Sélecteur de période ATR — calculez l'ATR à partir d'une période supérieure (ex. ATR H1 sur un graphique M15)
► Panneau d'information ATR (en haut à droite) — affiche la valeur ATR, la taille SL, et TP1/2/3 en pips
► Contrôle complet des couleurs — couleurs séparées pour SL, TP1, TP2, TP3, TP4/5 via les sélecteurs de couleur natifs de cTrader
► Style de ligne configurable (Solide / Tirets / Points) et épaisseur
► Prix Ask ou Bid comme référence d'entrée — choisissez selon la direction de votre trade
─────────────────────────────
PARAMÈTRES PAR DÉFAUT
→ Période ATR 14
→ Multiplicateur ATR 1,5× (SL = 1,5 × ATR)
→ Période ATR H1
→ Afficher TP1/2/3 ACTIVÉ
→ Afficher TP4/5 DÉSACTIVÉ
→ Direction Les deux (Long + Short)
→ Couleur SL Rouge
→ Couleur TP1 Or
→ Couleur TP2 Vert citron
→ Couleur TP3 Bleu Dodger
→ Style de ligne Tirets
─────────────────────────────
COMMENT UTILISER
1. Ajoutez l'indicateur à n'importe quel graphique
2. Réglez la période ATR et le multiplicateur pour correspondre à votre stratégie (1,5× ATR est standard pour Forex/Or)
3. Réglez la période ATR sur H1 ou H4 pour un dimensionnement SL plus fluide
4. Lisez les valeurs en pips directement sur les étiquettes du graphique
5. Utilisez TP1 (1R) pour la première sortie partielle, TP2 (2R) pour le seuil de rentabilité, TP3 (3R) pour l'objectif complet
6. Combinez avec les indicateurs BOS/CHoCH et FVG pour un flux de travail complet d'entrée SMC
─────────────────────────────
IDÉAL POUR
✔ Traders FTMO et prop firm qui doivent dimensionner le risque précisément
✔ Traders SMC et ICT utilisant les multiples R pour la gestion des trades
✔ Traders Forex, Or et Indices sur toutes les périodes
✔ Traders souhaitant une carte visuelle claire du risque avant chaque entrée
✔ Toute personne construisant une approche systématique du dimensionnement des positions
─────────────────────────────
COMPATIBILITÉ
→ Plateforme cTrader (Bureau & Web)
→ Classes d'actifs Forex, Indices, Matières premières, CFDs Crypto
→ Périodes Toutes (M1 à MN)
→ Droits d'accès Aucun requis
→ Type de compte Live & Démo
━━━━━━━━━━━━━━━━━━━━━━━━━━━━━━━━━━━━━━━━
Résumé
Avis clients
5 | 50 % | |
4 | 50 % | |
3 | 0 % | |
2 | 0 % | |
1 | 0 % |


![Logo de "[Hamster-Coder] Pivot Points MTF"](https://cdn.ctrader.com/image/webp/4c143e5a-309c-40e3-a578-f04d1e133ffa_31159)

