Keltner Channels advanced
Indicateur
Version 1.0, Apr 2026
Windows, Mac
5.0
Avis : 1
Description
Système Avancé de Nuage et de Cassure des Canaux Keltner
Les canaux Keltner standard sont un outil fantastique pour lire la volatilité et la direction de la tendance, mais tracer de simples lignes sur un graphique n'est que le début.
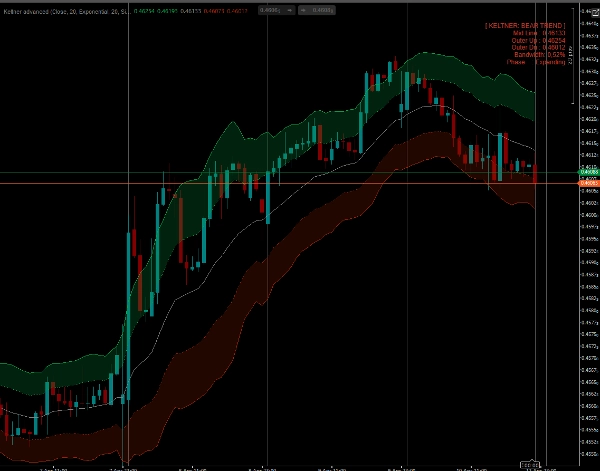
Le Keltner Avancé porte cet indicateur classique à un tout autre niveau. En introduisant un système de nuage à double bande, une détection de compression de largeur de bande et des barres de peinture intelligentes, il transforme un simple canal en un système de trading visuel complet pour les traders de cassure et de suivi de tendance.
Caractéristiques clés
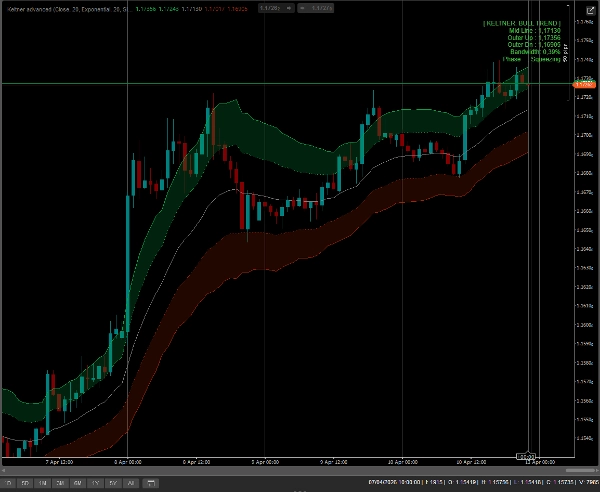
- Système de Nuage à Double Bande (Zones d'Action) : Au lieu d'un seul canal, cet indicateur trace une bande intérieure et une bande extérieure. L'espace entre elles est rempli d'un nuage dynamique.
-
- Prix à l'intérieur du nuage ? Vous êtes dans une "montée de tendance" forte et saine.
- Prix entre la ligne médiane et la bande intérieure ? Vous êtes dans une phase de repli / de retour à la moyenne.
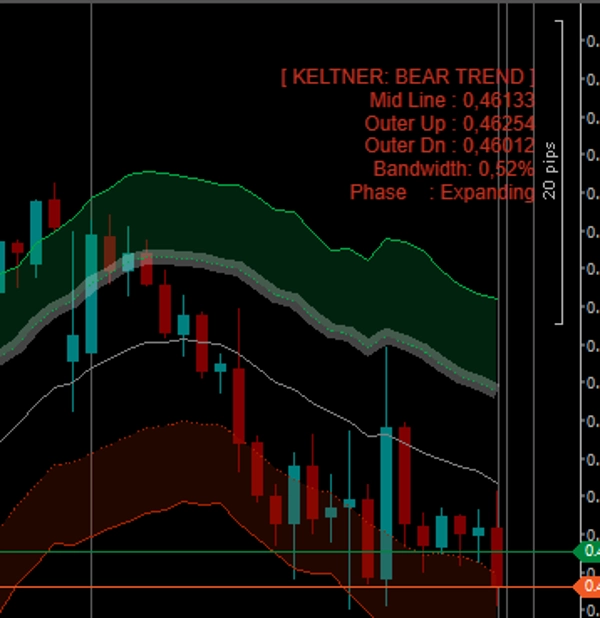
- Coloration Intelligente des Barres (Paintbars) : Vos chandeliers changeront de couleur en fonction de leur emplacement exact dans la structure du canal :
-
- Vert/Rouge Néon (Extrême) : Le prix dépasse la bande extérieure. Momentum massif ou climax !
- Vert/Rouge vif (Tendance) : Le prix évolue à l'intérieur du nuage Keltner.
- Vert/Rouge foncé (Repli) : Le prix revient vers la ligne médiane.
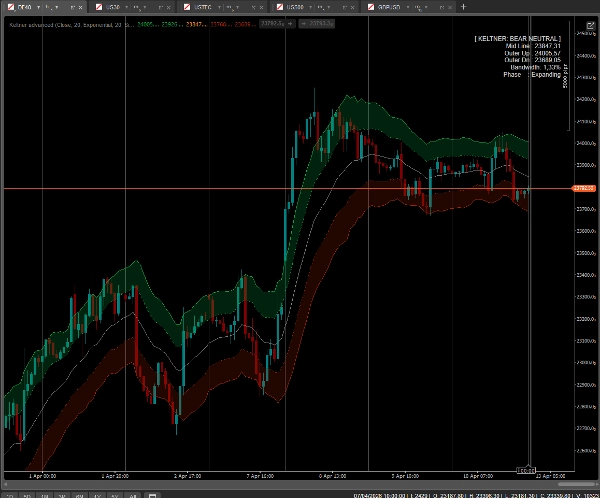
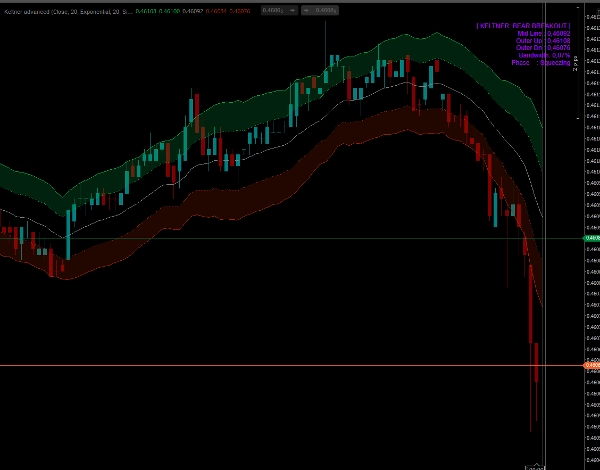
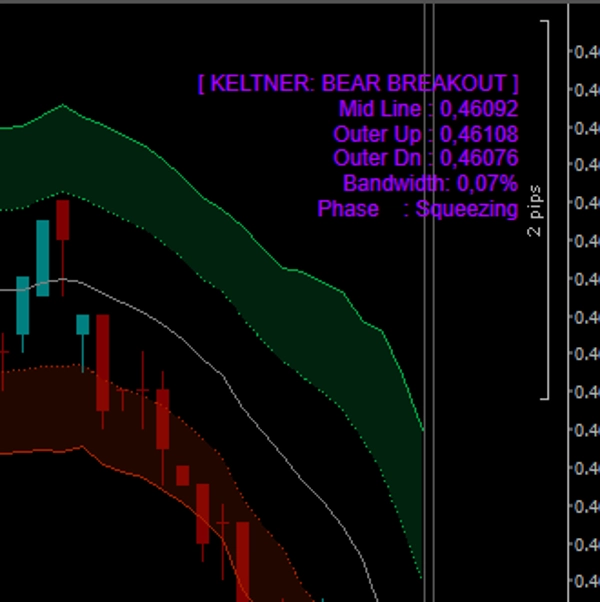
- Détection de Compression de la Largeur de Bande : L'indicateur calcule constamment la largeur du canal et la compare aux barres précédentes. Le tableau de bord vous indiquera précisément si le marché est en compression (se resserrant pour une cassure) ou en expansion.
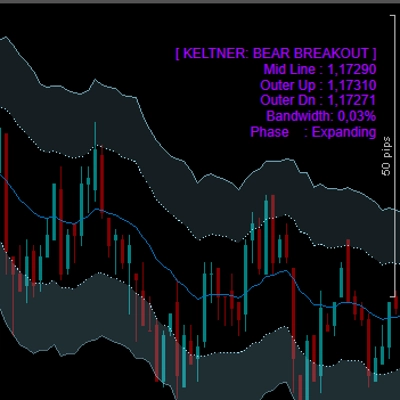
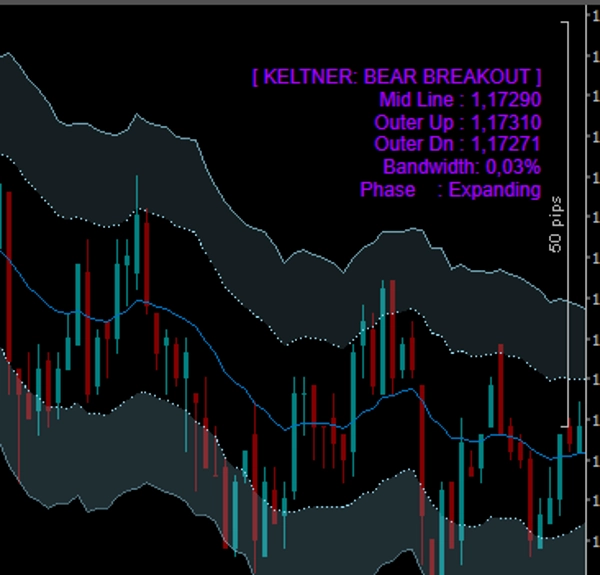
- Tableau de Bord en Temps Réel sur le Graphique : Un panneau élégant et non intrusif affiche l'état actuel du marché (tendance haussière, cassure baissière, neutre, etc.), les niveaux exacts des bandes, le pourcentage de largeur de bande et la phase de volatilité.
- Entièrement Débloqué : Tradez sur N'IMPORTE quel symbole (Forex, Crypto, Indices, Actions) et N'IMPORTE quel intervalle de temps sans aucune limitation. Accès à vie.
Comment trader avec ?
- La Cassure : Regardez le tableau de bord pour une phase de "compression". Lorsque le prix explose en dehors de la bande extérieure et que les chandeliers deviennent vert ou rouge néon, tradez la cassure avec un fort momentum.
- Suivi de Tendance : Une fois la tendance établie, restez dans votre trade tant que les chandeliers sont peints en vert/rouge vif et "glissent" à l'intérieur du nuage.
- Acheter la Baisse : Lorsque le prix revient vers la ligne médiane orange (les chandeliers deviennent vert foncé), cela présente souvent une entrée à faible risque pour rejoindre la tendance principale.
Résumé
Profil de l'indicateur
Catégorie de l'indicateur
Volatilité
Type de résultat
Visualisation
Signaux
Filtre
Exigences en matière de données
Barres seulement
Signaux pris en charge
Puissance de la tendance
Volatilité
Cassure
Avis clients
5.0
Avis : 1
5 | 100 % | |
4 | 0 % | |
3 | 0 % | |
2 | 0 % | |
1 | 0 % |
Discussion
Questions fréquentes
Key Levels
Channel
Les produits disponibles sur cTrader Store, notamment les bots de trading, les indicateurs et les plug-ins, sont fournis par des développeurs tiers et mis à disposition à titre informatif et à des fins d'accès technique uniquement. cTrader Store n'est pas un courtier et ne fournit aucun conseil en investissement, aucune recommandation personnelle ni aucune garantie quant aux performances futures.


![Logo de "[Hamster-Coder] Bollinger Bands"](https://cdn.ctrader.com/image/webp/21d8e5d6-fb11-4bac-b9ee-cd05c2b76804_30327)
Prix
24
Ventes
710
Installations gratuites