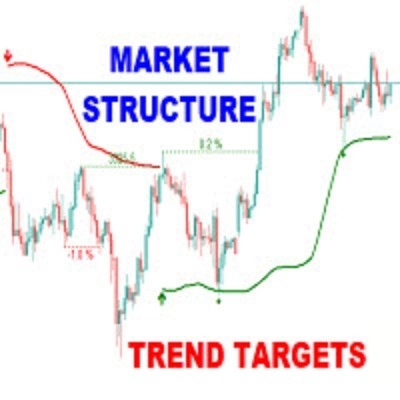
Description
Les objectifs de tendance de la structure du marché sont un indicateur de trading puissant conçu pour offrir aux traders une vue claire, structurée et basée sur les données de l'élan du marché, des cassures et des zones clés de réaction des prix. Basé sur les principes de l'analyse intelligente de la structure du marché, il aide à identifier non seulement la direction de la tendance, mais aussi les niveaux précis de cassure, l'épuisement de la tendance, et les zones potentielles de retournement — le tout avec une clarté visuelle et des métriques conviviales pour les traders.
Caractéristiques clés
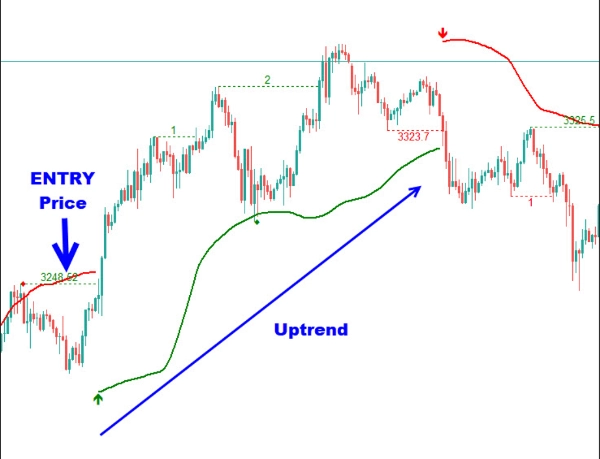
Points de cassure avec marqueurs numérotés
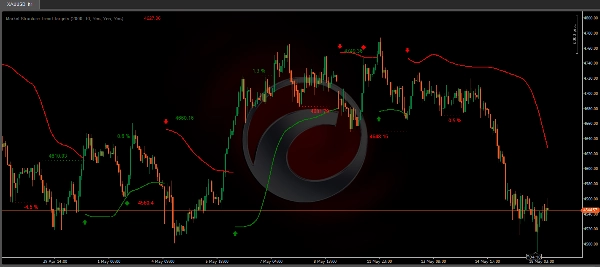
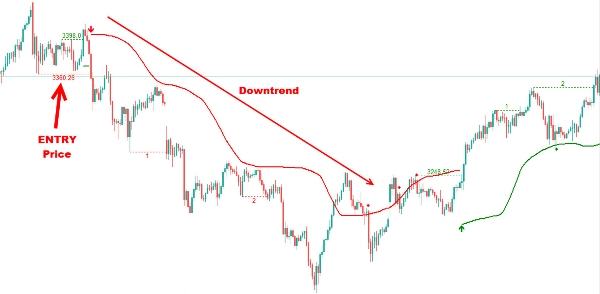
Suivez les cassures structurelles significatives avec des marqueurs numérotés séquentiels, vous aidant à suivre visuellement la progression de l'action des prix. Que le marché soit en tendance haussière ou baissière, chaque point de cassure est enregistré et affiché pour un suivi facile et une confirmation des changements structurels. La cassure initiale (cassure zéro) est marquée avec le prix d'entrée et une icône de flèche, tandis que les cassures suivantes dans la tendance sont numérotées séquentiellement (1, 2, 3…) pour indiquer la continuation de la tendance.
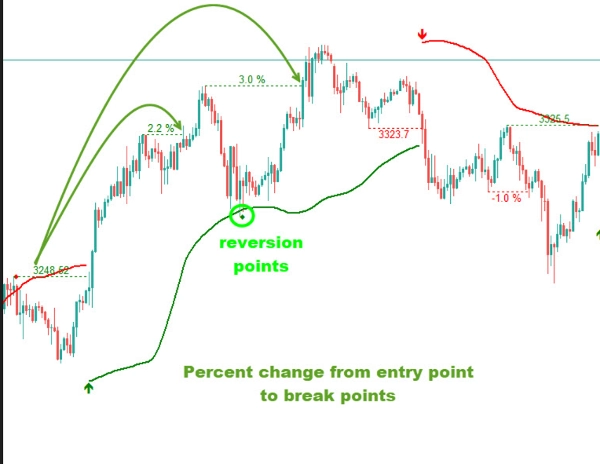
Changement en pourcentage
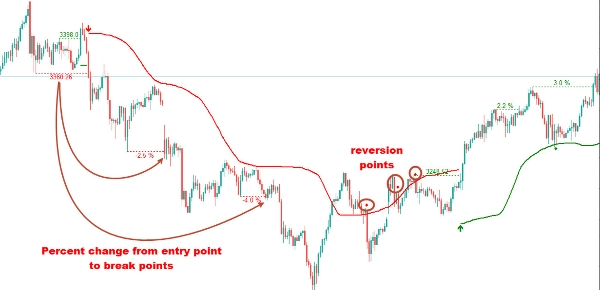
Voyez exactement combien le prix a évolué depuis chaque point de cassure avec des étiquettes de changement en pourcentage. Cela vous donne une idée en temps réel de la force du marché, de la volatilité et de l'épuisement potentiel, vous aidant à évaluer si un mouvement a encore de l'élan — ou s'il approche de sa limite.
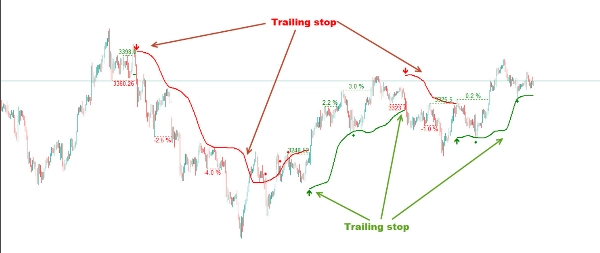
Niveaux de stop loss suiveur
Cet indicateur calcule automatiquement des niveaux dynamiques de stop loss basés sur les pivots structurels récents, la confirmation de cassure et la volatilité. Ces niveaux intelligents s'ajustent au fur et à mesure que le prix évolue, aidant les traders à suivre les tendances tout en gérant le risque avec précision. Si le prix franchit le niveau de stop loss, l'indicateur affichera des points indiquant une fin ou un retournement potentiel de la tendance.
Signaux de reversion
L'indicateur identifie les points potentiels de reversion à la moyenne avec des icônes en forme de diamant. En tendance haussière, si le prix tombe en dessous du stop loss puis repasse au-dessus, un diamant est tracé, suggérant une possible reversion à la moyenne. De même, en tendance baissière, si le prix dépasse le stop loss puis retombe en dessous, cela indique une possibilité de reversion.
Cas d'utilisation :
- Stratégies de suivi de tendance basées sur la structure du marché
- Confirmation pour les configurations Smart Money Concepts (SMC)
- Placement dynamique des objectifs et stops pour les traders swing et intraday
- Journalisation visuelle des trades et suivi des cassures
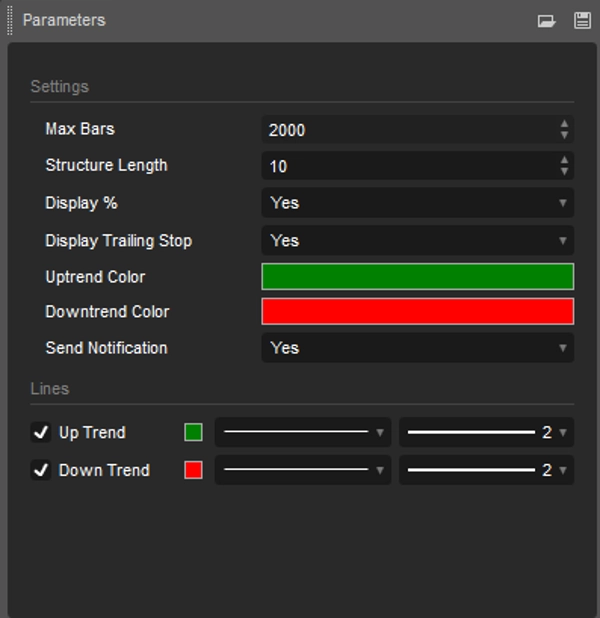
Entrées utilisateur :
- Longueur : Définit le nombre de barres utilisées pour identifier les pivots hauts et bas pour les cassures de tendance.
- Afficher le pourcentage : Option pour basculer entre l'affichage des numéros séquentiels de cassure ou le changement en pourcentage depuis la cassure initiale.
- Afficher le stop suiveur : Afficher le stop suiveur sur le graphique
- Couleurs pour la tendance haussière et baissière : Permet la personnalisation des zones de couleur pour les tendances haussières et baissières afin de correspondre aux préférences individuelles du graphique.
- Alerte/Notification : Permet d'envoyer une alerte ou une notification sur mobile
Les objectifs de tendance de la structure du marché transforment l'action des prix en informations exploitables et faciles à lire — offrant aux traders un avantage tactique avec clarté, contrôle et confiance.


