


Description
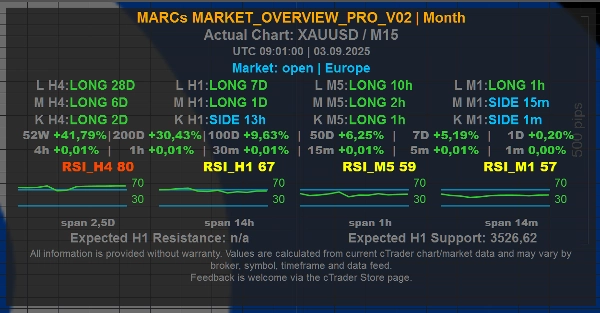
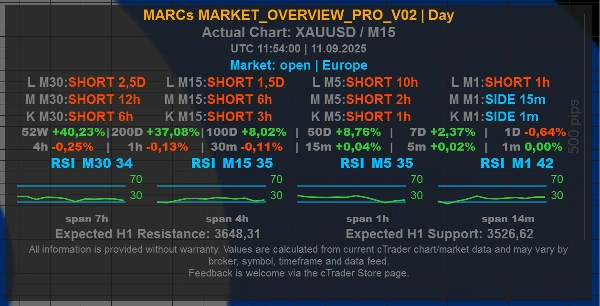
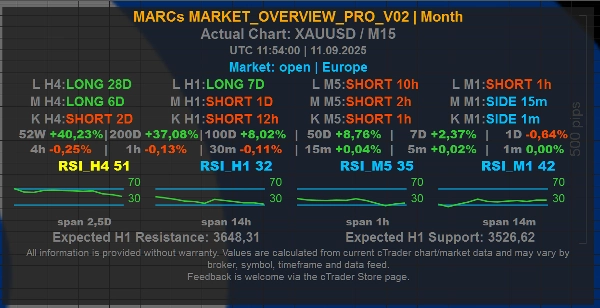
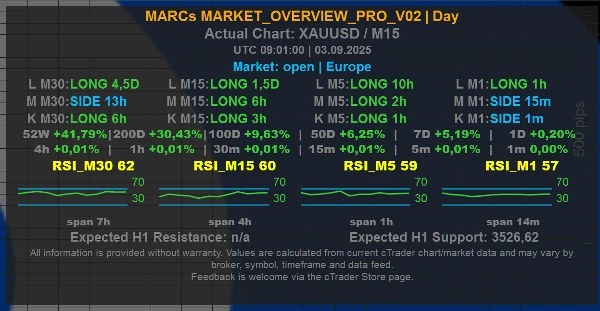
MARCs Market Overview Lite XAUUSD est un indicateur d’aperçu de marché gratuit et à portée réduite pour cTrader.
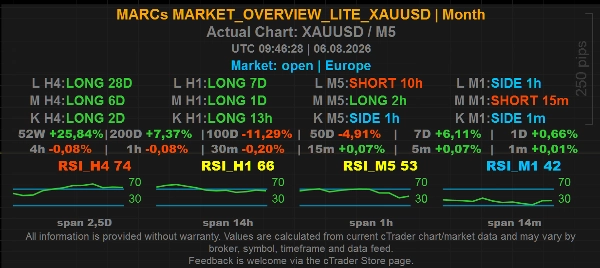
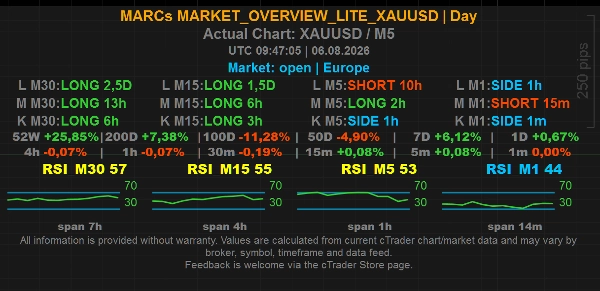
Il affiche un tableau de bord compact sur le graphique pour les graphiques XAUUSD / Or avec un contexte de tendance multi-échelles temporelles, des lectures RSI, des informations sur le marché/la session, des valeurs optionnelles au niveau du graphique et un ensemble simplifié de contrôles d’affichage.
Cette édition Lite est conçue comme un outil d’aperçu ciblé pour XAUUSD. Elle conserve le flux de travail principal du panneau de MARCs Market Overview tout en utilisant des réglages internes fixes et une sélection limitée de préréglages.
Principales caractéristiques :
- Édition Lite gratuite pour les graphiques XAUUSD
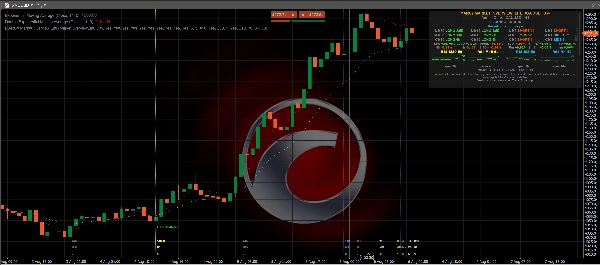
- Panneau d’aperçu de marché compact sur le graphique
- Lignes de tendance multi-échelles temporelles pour un contexte de marché court, moyen et long
- Valeurs RSI et mini historique RSI sur des échelles temporelles internes fixes
- Ligne de marché/session avec heure UTC
- Préréglages d’horizon temporel Jour et Mois
- Ligne de marché optionnelle
- Valeurs optionnelles au niveau H1 affichées directement dans le panneau
- Lignes de niveau H1 simplifiées optionnelles sur le graphique
- Étiquettes de ligne optionnelles, marqueurs d’origine de niveau et marqueurs de retour en arrière
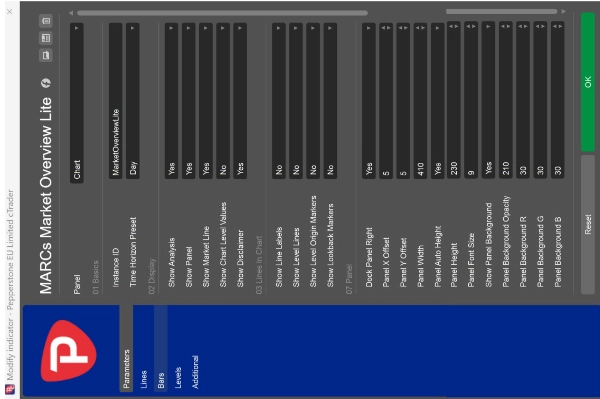
- Position, largeur, hauteur, taille de police et apparence de fond du panneau entièrement ajustables
Limitations de l’édition Lite :
- Fonctionne uniquement sur les graphiques XAUUSD
- Le préréglage d’horizon temporel est limité à Jour et Mois
- Les lignes de tendance utilisent des réglages internes fixes d’échelle temporelle et de chandeliers
- L’affichage RSI utilise des réglages internes fixes
- L’affichage du temps utilise des réglages internes fixes
- Les valeurs au niveau du graphique sont limitées à H1
- Les lignes de niveau du graphique sont disponibles comme option simplifiée marche/arrêt et utilisent des niveaux H1 fixes
- Certaines options de personnalisation avancées de la version Pro ne sont pas incluses
Si l’indicateur est attaché à un autre symbole, le panneau affiche un avis clair réservé à XAUUSD au lieu d’afficher les valeurs d’aperçu.
Lignes de niveau et valeurs au niveau du graphique :
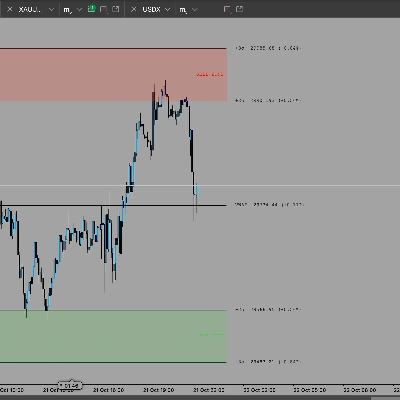
Le réglage optionnel Afficher les lignes de niveau peut afficher les niveaux de référence calculés du graphique H1. Dans l’édition Lite, cela est simplifié en une option marche/arrêt. Lorsqu’il est activé, l’indicateur affiche la résistance calculée la plus proche au-dessus du prix actuel et le support calculé le plus proche en dessous du prix actuel.
Le réglage optionnel Afficher les valeurs au niveau du graphique peut afficher les mêmes valeurs de référence de résistance/support H1 les plus proches directement dans le panneau sans tracer de lignes sur le graphique. La ligne du panneau est étiquetée, par exemple, « Chart Levels H1 | R ... | S ... » pour indiquer clairement que les valeurs se réfèrent aux références au niveau du graphique.
Comment les lignes de niveau sont calculées :
Les niveaux sont dérivés des hauts et bas de balancement passés dans l’échelle temporelle interne sélectionnée. Les points de balancement proches sont regroupés en grappes de niveaux, et seules les zones avec suffisamment de contacts répétés sont affichées. Cela fait des lignes des marqueurs visuels de contexte de marché basés sur l’historique disponible du graphique.
Ce que les lignes de niveau ne signifient pas :
Les lignes de niveau ne sont pas des signaux d’achat, des signaux de vente, des recommandations de stop-loss, des recommandations de take-profit ou des conseils d’investissement. Elles ne prédisent pas que le prix va rebondir, casser ou réagir à un niveau spécifique.
À propos de la version Pro :
MARCs Market Overview Pro offre une utilisation plus large des symboles, plus de préréglages d’horizon temporel et des options de personnalisation plus détaillées. L’édition Lite XAUUSD est une version gratuite et ciblée pour les traders qui souhaitent un panneau d’aperçu de marché Or/XAUUSD plus simple.
Important :
MARCs Market Overview Lite XAUUSD est un outil d’aperçu de marché uniquement d’analyse. Il ne place pas d’ordres, ne gère pas les positions, ne fournit pas de conseils d’investissement et ne garantit pas les résultats de trading.
Toutes les lectures dépendent des données de graphique cTrader disponibles, du flux de symboles du courtier, de l’échelle temporelle et de l’historique du marché. Les valeurs peuvent différer entre courtiers, symboles et flux de données.
Le trading comporte des risques. Les performances passées ne garantissent pas les résultats futurs.
NOTE DE TRANSPARENCE
Cet indicateur a été développé avec l’aide d’outils basés sur l’IA.
Résumé
Level lines are calculated from past swing highs and lows on the H1 timeframe, highlighting key resistance and support clusters based on repeated price touches. These lines serve as visual market context markers but do not constitute trading signals or advice.
The panel’s position, size, font, and background appearance are fully adjustable. The Lite edition uses fixed internal settings and limited presets, restricting its use to XAUUSD charts only. It does not place trades or provide investment recommendations. This tool relies on available chart data and broker feeds, which may vary.
This edition offers a streamlined overview for Gold traders, with broader symbol support and customization available in the Pro version.
Discussion
Avis clients
5 | 0 % | |
4 | 100 % | |
3 | 0 % | |
2 | 0 % | |
1 | 0 % |
Questions fréquentes















Prix