Description
Aperçu de l'indicateur
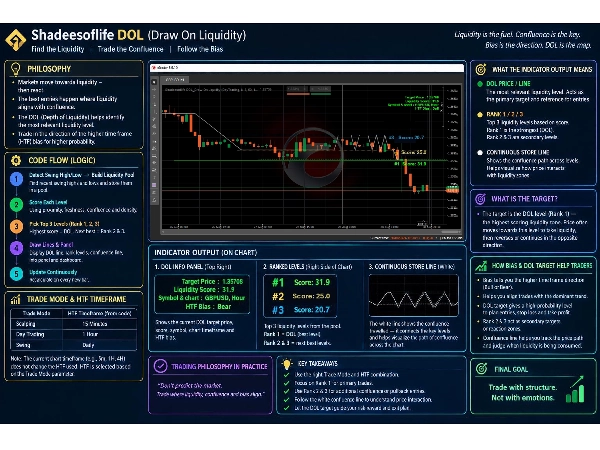
L'indicateur Shadeesoflife DOL (Draw on Liquidity) c Trader offre un moteur dynamique d'identification de cibles basé sur les concepts Smart Money (SMC) et les principes ICT. Il trace automatiquement une Ligne sur la Liquidité (DOL), classe et suit les pools de liquidité structurelle - "Haute confluence" sur le marché à chaque tick. DOL est une cible dynamique, liquidité à haute confluence.
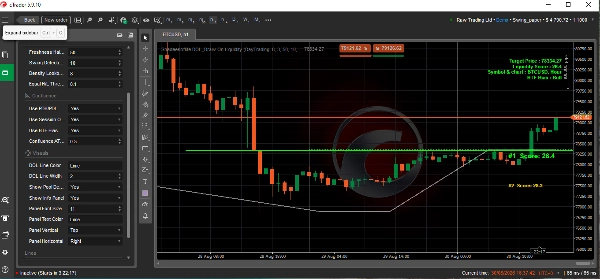
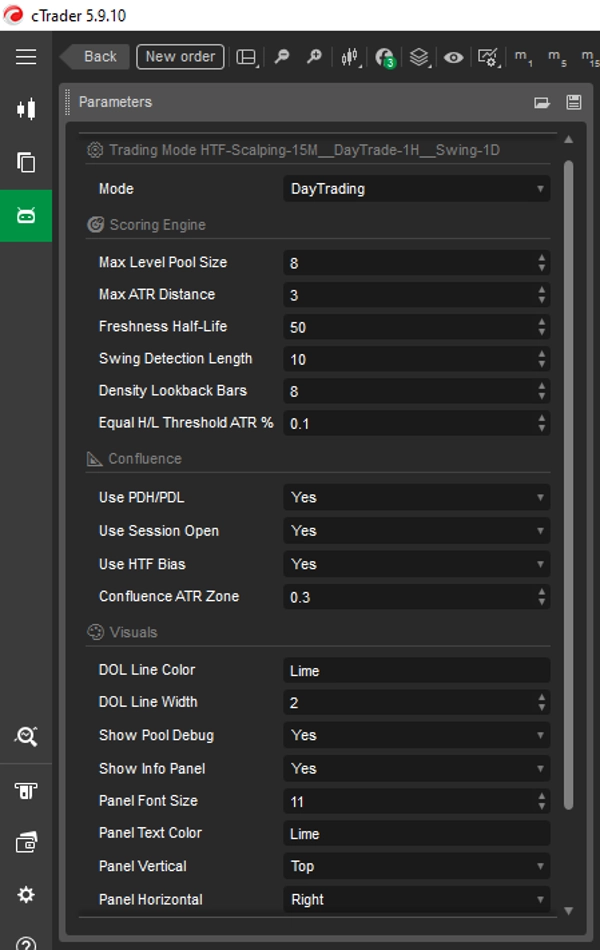
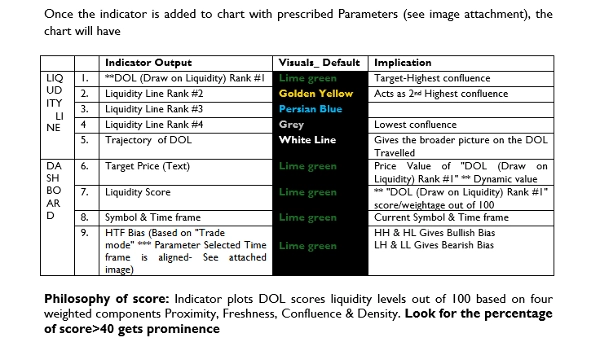
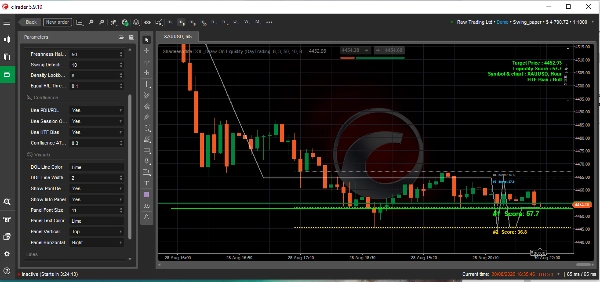
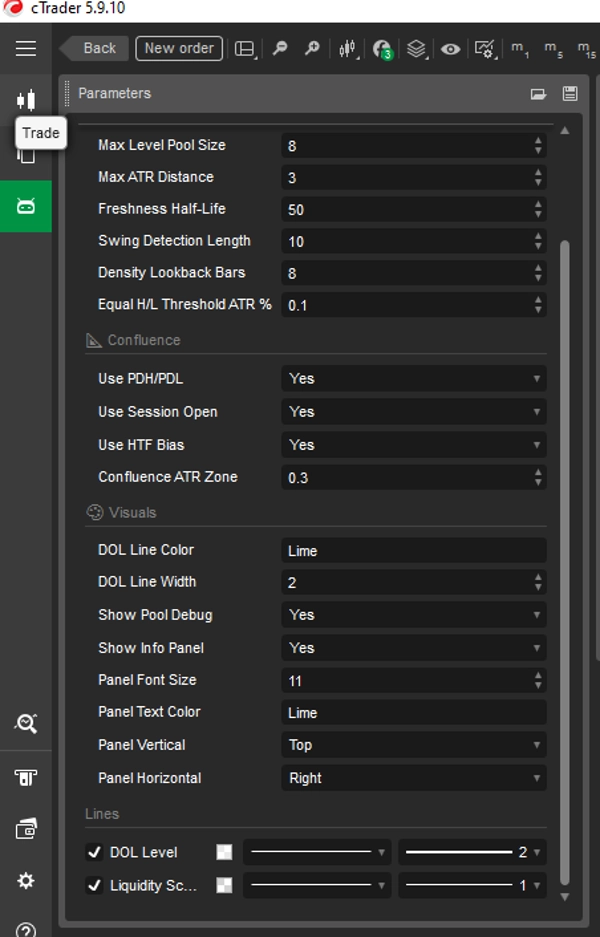
L'indicateur affiche une cible principale DOL (niveau le mieux noté, affiché comme une ligne proéminente) ainsi qu'un pool classé de cibles secondaires de liquidité, tout en fournissant un panneau à l'écran montrant le biais HTF actuel et les métriques de cible. Une fois l'indicateur ajouté au graphique avec les paramètres prescrits (voir image jointe), le graphique affichera
Pour la réponse - voir l'image jointe (Tableau).
Philosophie du score : L'indicateur trace les scores DOL des niveaux de liquidité sur 100 basés sur quatre composants pondérés Proximité, Fraîcheur, Confluence & Densité.
FAQ
1.Comment cela fonctionne-t-il - Cadre stratégique multi-échelles HTF & LTF??
Identification du biais et de la direction à plus grande échelle temporelle (HTF)
L'indicateur détermine le biais structurel en utilisant la sélection du mode de trading sous-jacent pour référencer une échelle temporelle supérieure (par exemple, ***Daily pour Swing, 1 heure pour Day Trading, 15 minutes pour Scalping) :
- Biais HTF haussier :
- Condition : La bougie HTF clôture plus haut que son ouverture (HTF haussier).
- Comportement de l'indicateur : Le moteur de notation montre que le prix cible (ligne marquée avec le score #1) est situé en dessous du prix Ask/bid (la cible HTF montre la liquidité interne et la cible LTF montre la liquidité externe).
- Implication de trading : Le prix cherche la liquidité côté vente (SSL) en dessous pour un retracement à prix réduit avant de continuer à la hausse, ou vise la liquidité côté achat (BSL) au-dessus comme cible ultime d'expansion.
- Biais HTF baissier :
- Condition : La bougie HTF clôture plus bas que son ouverture (HTF baissier).
- Comportement de l'indicateur : Le moteur de notation montre que le prix cible (ligne marquée avec le score #1) est situé au-dessus du prix Ask/bid (la cible HTF montre la liquidité interne et la cible LTF montre la liquidité externe).
- Implication de trading : Le prix cherche la liquidité côté achat (BSL) au-dessus pour un retracement premium avant de descendre, ou vise la liquidité côté vente (SSL) en dessous.
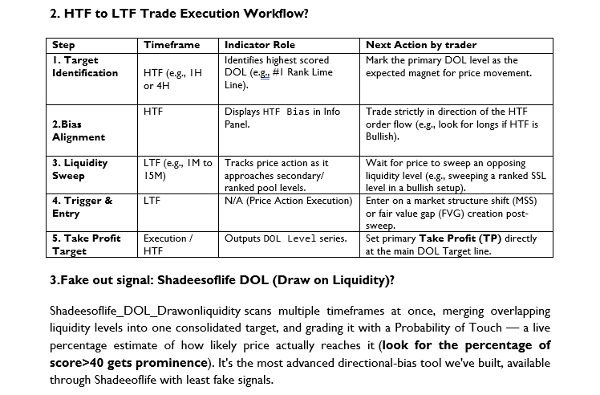
2. Flux d'exécution du trade HTF vers LTF ?
Pour la réponse - voir image jointe (Tableau).
3.Signal faux : Shadeesoflife DOL (Draw on Liquidity)?
"Shadeesoflife DOL Draw on liquidity" scanne plusieurs échelles temporelles simultanément, fusionnant les niveaux de liquidité qui se chevauchent en une cible consolidée, et la note avec une Probabilité de Toucher — une estimation en pourcentage en direct de la probabilité que le prix l'atteigne réellement (cherchez le pourcentage de score>40 qui prend de l'importance). C'est l'outil de biais directionnel le plus avancé que nous avons conçu, disponible via Shadeeoflife avec le moins de signaux faux.
4. Comment fonctionne la Confluence dans "Shadeesoflife DOL Draw on liquidity" techniquement ?
"Shadeesoflife DOL Draw on liquidity" scanne la liquidité interne, la liquidité externe, les blocs d'ordre, les blocs de rupture, les FVGs, iFVGs, et BSL/SSL pour son biais directionnel. DOL Pro fonctionne sur un moteur complètement différent — il scanne EQH/EQL, grands FVGs, limites de session, PDH/PDL, et les gaps nocturnes/week-end sur plusieurs échelles temporelles, lit le biais de session comme les swings Judas et les continuations, et note sa cible avec une Probabilité de Toucher en direct, avec des algorithmes beaucoup plus intelligents. Même mission de biais directionnel que DOL, construit sur un moteur plus rigoureux. Fournit le résultat d'une configuration à haute probabilité en fournissant la direction et la cible à haute confluence du prix.
Lit plusieurs échelles temporelles à la fois, pas seulement une, Scanne EQH/EQL, grands FVGs, limites de session, PDH/PDL, et gaps nocturnes/week-end. Lit le biais de session — motifs comme les swings Judas et les continuations.
┌──────────────────────────────────────┐
│ CONCEPTS ICT / LIQUIDITÉ │
│ DOL • PDH • PDL • Session • HTF │
│ Liquidité • Haut/ Bas égal │
└──────────────────┬───────────────────┘
↓
┌──────────────────────────────────────┐
│ COUCHE SMC / STRUCTURE │
│ Swing High • Swing Low │
│ Pools de liquidité • Direction HTF │
└──────────────────┬───────────────────┘
↓
┌─────────────────────────────────────────┐
│ MOTEUR QUANT SHADEESOFLIFE │
│ Proximité X% + Fraîcheur Y% + Confluence Z% + Densité A% │
│ │
│ → Score 0–100 → Rang #1/#2/#3 → DOL dynamique │
└─────────────────────────────────────────┘
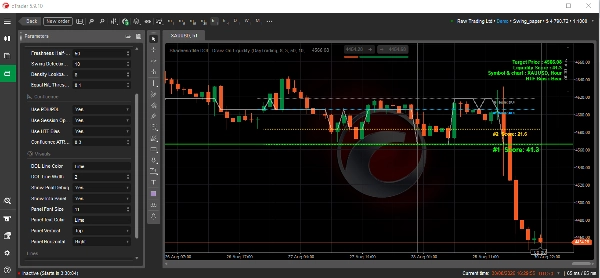
📊Analyse technique du graphique (interprétation de l'image jointe)
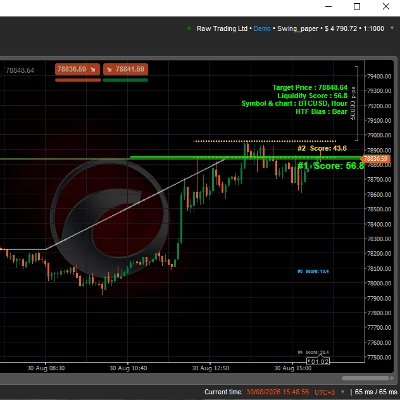
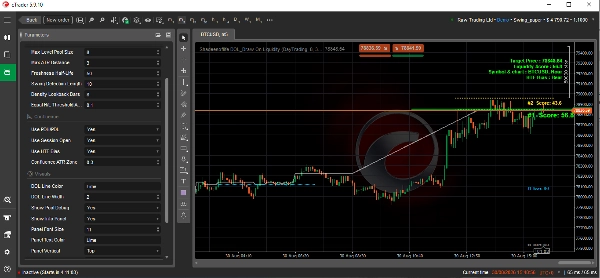
Ce graphique de la plateforme de trading cTrader affiche BTCUSD (Bitcoin / Dollar américain) sur un horizon temporel de 5 minutes (m5). Il présente un indicateur de structure de marché automatisé personnalisé appelé "Shadeesoflife DOL Draw On Liquidity", configuré selon les concepts Smart Money (SMC).
🔎 Principaux indicateurs techniques & analyse
- Prix actuel : L'actif se négocie à 78 856,48, évoluant étroitement dans une fourchette très étroite et à haute liquidité.
- Prix cible / Draw on Liquidity (DOL) : Marqué par la ligne horizontale verte brillante solide à 78 848,64. Cela sert de puissant aimant pour l'action des prix.
- Score de liquidité (57,3) : Un score modéré indiquant des ordres institutionnels stables mais non écrasants autour de cette poche.
- Biais à plus grande échelle temporelle (HTF) : Explicitement étiqueté comme baissier (Bear). Le système cherche une continuation à la baisse une fois la liquidité d'achat au repos dégagée.
- Scores de priorité algorithmique :
- Score #1 (57,3) : Situé juste à la ligne cible verte.
- Score #2 (45,8) : Reposant légèrement plus haut au niveau de la ligne de base rouge.
💡 Interprétation stratégique principale
L'indicateur cartographie une configuration classique SMC où le moteur du marché cherche à balayer des pools institutionnels spécifiques.
- L'effet aimant : Le prix a poussé vers le haut dans une zone premium et gravite maintenant fortement vers la ligne de base verte Draw on Liquidity (DOL) à 78 848,64.
- Alignement de la tendance : Parce que le biais structurel HTF est baissier, cette traction locale vers le bas vers la ligne DOL s'aligne parfaitement avec la tendance dominante.
- Dégagement de liquidité : Une fois que le prix cible et atténue la liquidité au repos à cette ligne verte, les traders surveillent généralement une rupture structurelle décisive ou une continuation agressive de la direction macro baissière.
Note :
- Peut être utilisé sur BTCUSD, XAUUSD, GBPUSD ou tout autre symbole.
- L'analyse BTCUSD ci-dessus est basée sur le graphique LTF 5m (sélection manuelle du graphique) et HTF 1DAY (paramètre “Trade Mode” pour Day trade depuis la sélection déroulante).
- L'indicateur peut être utilisé pour (la sélection du paramètre “Trade Mode” s'aligne sur l'échelle temporelle pour le BIAS)
- Scalping - HTF 15M, (par défaut)
- Day trade - HTF 1H,
- Swing trade - HTF 1D,
- Trade quatre heures - HTF 4H
- Le paramètre "Show pool debug" peut être utilisé pour désactiver la ligne de confluence de cible moins importante sauf la classée #1.
- Le paramètre "Show info panel" peut être utilisé pour désactiver ou cacher le panneau.
- Le "Panneau" peut être personnalisé avec la taille du texte, la couleur du texte & la position du panneau (position horizontale/ verticale).
- La position de la ligne "DOL level" sur l'axe X (Prix) indique la ligne de confluence de cible classée #1 à la coordonnée correspondante de l'axe Y (Temps).
Résumé
The indicator outputs a primary Draw on Liquidity (DOL) target line representing the highest-scored liquidity level, along with secondary ranked targets. It provides an on-screen panel displaying higher timeframe (HTF) bias and target metrics, supporting trading styles from scalping to swing trading by referencing appropriate HTFs (e.g., 15-minute for scalping, daily for swing).
Shadeesoflife DOL integrates multi-timeframe analysis, scanning equal highs/lows, fair value gaps, session boundaries, previous day highs/lows, and gaps to assess directional bias and price magnet levels. It calculates a live Probability of Touch (PoT) percentage estimating the likelihood of price reaching each target.
Traders use the indicator to align trades with HTF bias, identify liquidity sweeps on lower timeframes, and set entries and take profit targets at ranked liquidity pools. It supports markets including BTCUSD and XAUUSD and offers customizable display options for target lines and info panels.