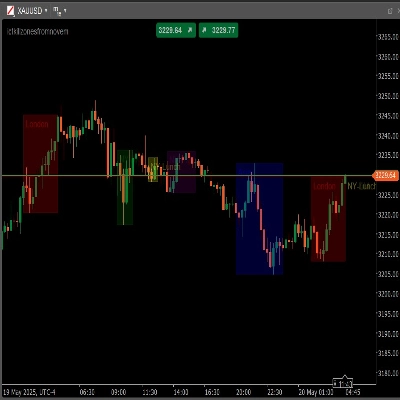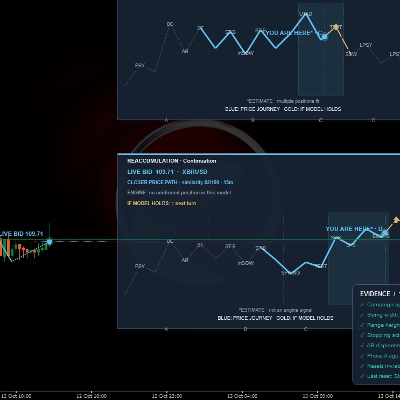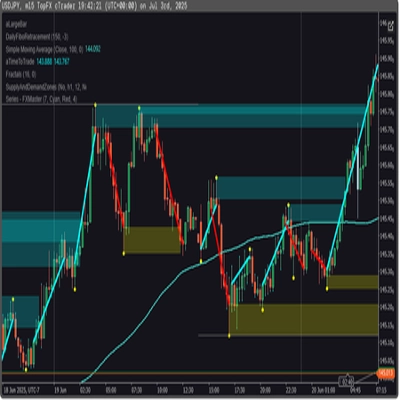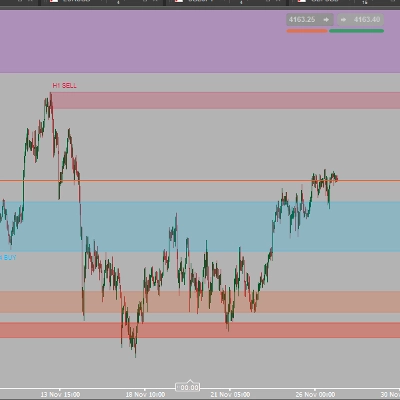
Description
Launch price: $19 until November 14, 2026. After that date, the price returns to $33.
Price keeps moving. Is momentum keeping up?
PulseFlow RSI Deep Buyer-Seller shows you when momentum stops confirming price. It marks RSI divergences directly on your chart, so you can recognize potential momentum shifts at a glance and plan your next move with clear references. It helps you make better decisions with more context.
From observation to a trade plan
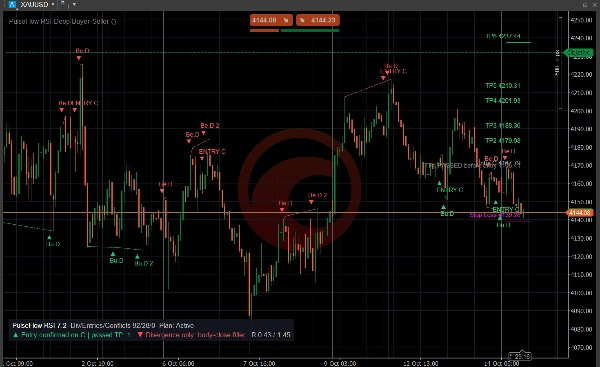
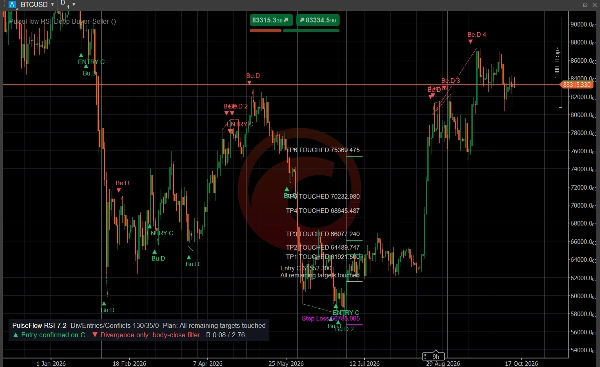
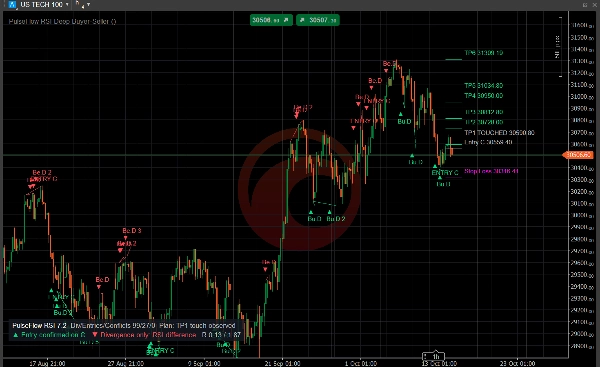
- Bullish (Bu.D) and bearish (Be.D) divergence markers, with a dashed line from the origin to the endpoint of each divergence.
- Divergences that pass your entry filters are marked ENTRY C and get a full plan: entry reference, stop and six price targets.
- Targets already passed before the entry are shown in grey, and targets touched afterwards are labelled on the chart.
A chart that adapts to you
- Adjust RSI settings, entry filters, stop and target levels, colors and line length.
- Optional overbought and oversold markers, and optional markers for divergences that do not qualify as entries.
- A compact status panel at the bottom-left keeps the latest decision in view without covering the chart.
The latest plan in view
By default, only the latest qualified entry levels are shown. Enable historical trade levels in the settings to review previous setups.
Alerts
Optional cTrader pop-up alerts for new entries, new divergences, stop and target touches, and expired plans.
Type, instruments and timeframes
Chart overlay indicator for momentum and divergence analysis. It is designed for cryptocurrencies, stock indices, metals such as gold, and other non-forex markets, on H1 and higher timeframes. On forex pairs and below H1 it is less reliable. Markers and plans are drawn once the confirming bar has closed, at the open of the next bar.
Use it to organize your analysis and assess opportunities with clear references. The indicator does not open or manage trades. Trading involves risk. Past performance does not guarantee future results.