
설명
🚀 정밀한 심지 시각화로 렌코 트레이딩을 혁신하세요
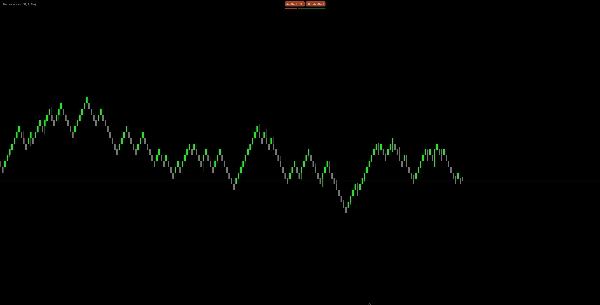
표준 렌코 차트가 보여주지 않는 숨겨진 시장 데이터를 공개합니다! 📈
✨ 이 지표가 특별한 이유는?
🎯 진정한 틱 단위 분석 - 추측하는 다른 지표와 달리, 이 도구는 각 렌코 브릭 내의 모든 틱을 분석하여 형성 중에 발생한 실제 가격 극단값을 드러냅니다.
🔍 다른 사람들이 놓치는 것을 보세요 - 각 렌코 브릭 내부에서 발생한 진짜 고점과 저점을 발견하여 더 나은 진입 및 청산 결정을 위한 중요한 시장 통찰력을 제공합니다.
💪 차별화된 주요 기능:
🏗️ 스마트 로컬 저장 기술
- 계산된 모든 심지를 자동으로 로컬 저장소에 저장
- 데이터 손실 없음 - 차트, 시간 프레임 변경 또는 cTrader 재시작 시에도 안전하게 보존
- 지능형 점진적 로딩으로 기존 데이터 재계산 방지
- 플랫폼 재시작 시 최소한의 성능 영향
⚡ 초고속 성능
- 실시간 진행 표시와 함께 일별 점진적 로딩
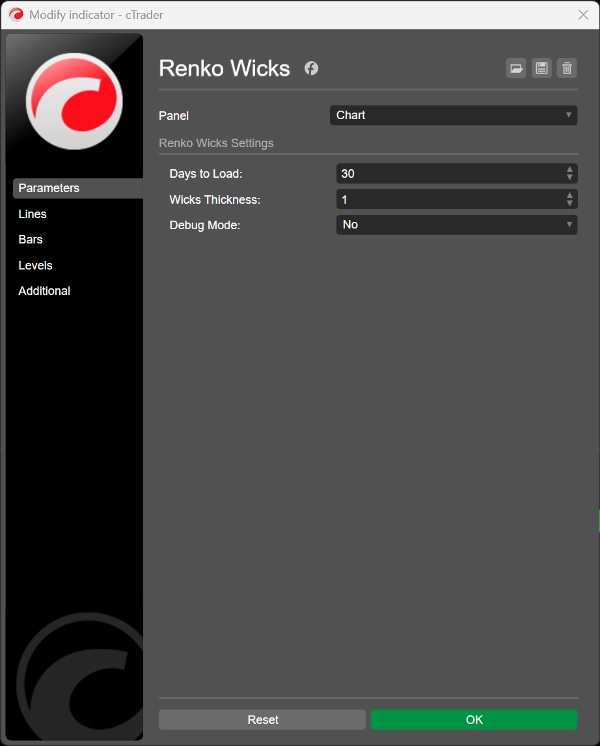
- 설정 가능한 히스토리 깊이 (1일 이상)
- 원활한 차트 작동을 위한 최적화된 메모리 사용
🎨 전문적인 시각 디자인
- 차트의 상승/하락 색상 구성과 자동 매칭
- 완벽한 가시성을 위한 조절 가능한 심지 두께 (1-5 픽셀)
- 분석을 돋보이게 하는 깔끔하고 방해되지 않는 표시
🛡️ 튼튼한 신뢰성
- 100% 데이터 지속성 - 플랫폼 재시작, 차트 전환, 시간 프레임 변경 시에도 심지가 유지됩니다
- 지능형 중복 방지로 깔끔한 차트 유지
- 최대 안정성을 위한 내장 오류 처리
- 투명성과 문제 해결을 위한 디버그 모드
🎯 완벽한 대상:
📊 데이 트레이더 - 정밀한 스캘핑 기회를 위한 일중 극단값 포착
📈 스윙 트레이더 - 렌코 브릭 내 주요 지지/저항 수준 식별
🔄 다중 시간 프레임 분석 - 각 시간 프레임별로 별도의 심지 데이터베이스 유지
🚨 렌코 심지가 중요한 이유:
표준 렌코 차트는 각 브릭의 시가와 종가만 보여주지만, 그 사이에 엄청난 가격 변동이 발생합니다! 이 지표는 다음을 보여줍니다:
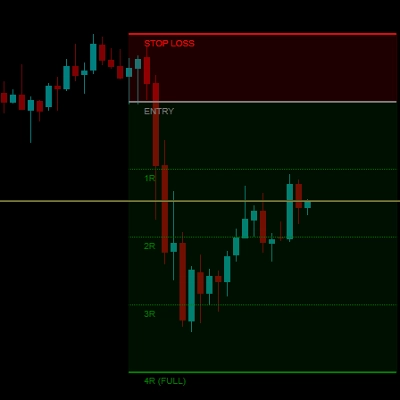
- 📉 실제 지지/저항 수준 - 가격이 실제로 닿은 지점
- 🎪 각 브릭 형성 내 시장 변동성 통찰
- 🎯 실제 가격 극단값에 기반한 더 나은 진입/청산 포인트
- 📊 정보에 기반한 결정을 위한 향상된 시장 구조 분석
실제 렌코 트레이더가 만든 ♥
요약
AI 요약
Renko Wicks Pro is an indicator designed to enhance Renko chart analysis by displaying the true price wicks or tails within each Renko brick. Unlike standard Renko charts that show only open and close prices, this tool performs tick-level analysis to reveal actual intrabrick price extremes, providing deeper insights into market volatility and support/resistance levels.
Key features include smart local storage that preserves calculated wick data across chart switches, timeframes, and platform restarts, ensuring data persistence and minimizing recalculations. The indicator offers fast, progressive day-by-day data loading with configurable history depth and optimized memory usage for smooth performance. Visually, it adapts to the chart’s bull/bear color scheme and allows adjustable wick thickness for clear, non-intrusive display.
Renko Wicks Pro supports multiple timeframes, maintaining separate wick databases for each, making it suitable for day traders seeking precise scalping points and swing traders identifying key levels. It includes built-in error handling, duplicate prevention, and a debug mode for stability and troubleshooting.
By revealing hidden price movements within Renko bricks, this indicator aids in identifying true market structure, improving entry and exit decisions based on actual price extremes.
지표 프로필
고객 리뷰
0.0
리뷰: 0
고객 리뷰
이 상품에 대한 리뷰가 아직 없습니다. 이미 사용해 보셨나요? 다른 사람들에게 가장 먼저 소개해 주세요!
상담
자주 묻는 질문(FAQ)
트레이딩 봇, 지표, 플러그인 등 cTrader Store에서 제공되는 상품은 제3자 개발자에 의해 제공되며, 이는 단순히 정보 및 기술적 접근을 목적으로 제공된 것입니다. cTrader Store는 중개인이 아니며, 투자 조언, 개인별 추천 또는 향후 성과에 대한 어떠한 보장도 제공하지 않습니다.


가격
239.94M
거래량
1.84M
핍 수익
2
판매
4.83K
무료 설치