ICT Breakers_BOS_MSS
インジケーター
バージョン 1.0、Nov 2025
Windows、Mac
🚀 ICT Breakers (BOS/MSS) - マスターマーケット構造の変化
ICT Breakersでプロのトレーディングインサイトを解放しましょう。これは重要なマーケット構造の変化を特定するための究極のツールです。Institutional Composite Trader (ICT) の手法に基づき、このインジケーターはプロのトレーダーがトレンドの継続や反転を特定するために使用するBreak of Structure (BOS) と Market Structure Shift (MSS) のパターンを自動的に検出します。
🔥 主な特徴
🎯 スマートシグナル検出
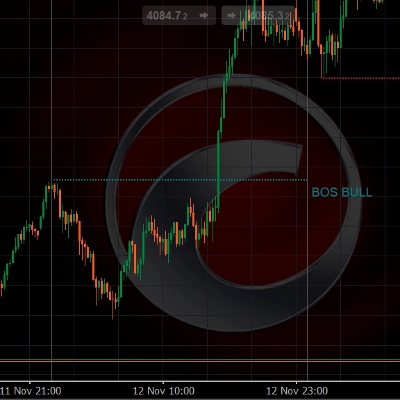
- Break of Structure (BOS): トレンド継続のシグナルを特定します
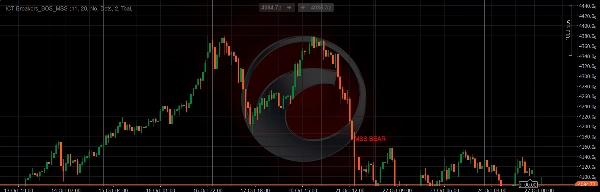
- Market Structure Shift (MSS): 潜在的なトレンド反転ポイントを見つけます
- マルチタイムフレーム分析: 低いタイムフレームチャート上の高いタイムフレーム構造
- カスタマイズ可能な感度: 最適な検出のためにスイングバーのパラメータを調整
🎨 プロフェッショナルな視覚化
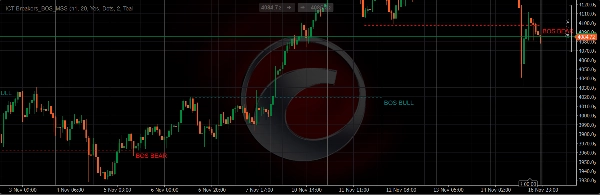
- 色分けされたシグナル: 強気/弱気のBOSとMSSに異なる色
- カスタマイズ可能なスタイル: 実線、点線、破線から選択可能
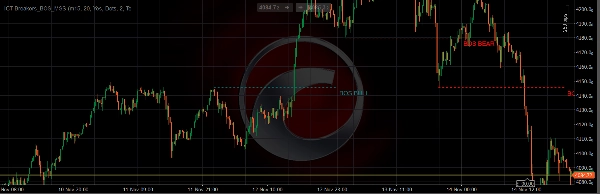
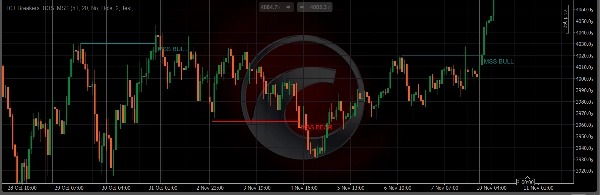
- 明確なラベル: 各シグナルに「BOS BULL」、「BOS BEAR」、「MSS BULL」または「MSS BEAR」と表示
- 複数の表示オプション: BOSまたはMSSを独立して表示/非表示可能
⚡ 高度な設定
- ボディ/ウィック検出: ボディのみかボディ+ウィックのブレイク基準を選択可能
- 調整可能なタイムフレーム: 任意の高いタイムフレームから構造を分析
- 柔軟なスイング設定: ピボットポイントの感度をカスタマイズ
- 視覚的カスタマイズ: 色、線のスタイル、幅を完全にコントロール
🔔 スマートアラートシステム
- 視覚的アラート: チャート上のテキスト通知
- 音声アラート: 任意のサウンド通知
- 非再描画: 一度形成されたシグナルは一貫性を保つ
- カスタムアラート名: アラートメッセージを個別に設定可能
📈 仕組み
ICT Breakersは価格の動きを分析し、市場構造が破られている時を特定します:
- BOS (Break of Structure): 価格がトレンド方向に以前の構造を破ると発生し、継続を示します
- MSS (Market Structure Shift): 価格がトレンドに逆らって構造を破ると発生し、潜在的な反転を示します
このインジケーターは複数のタイムフレームにわたる高度なピボットポイント検出を使用し、正確でタイムリーなシグナルを提供して、以下を支援します:
- トレンド継続を早期に捉える
- 潜在的な反転を事前に見つける
- 機関レベルの市場構造認識で取引する
- マルチタイムフレームの確認で誤シグナルを減らす
🎯 こんな方に最適
- 機関のコンセプトを求めるプライスアクショントレーダー
- ICT手法のフォロワー
- 明確な構造ブレイクシグナルを求めるトレーダー
- マルチタイムフレーム分析愛好者
- 自動化された市場構造モニタリングを望む方
⚙️ 簡単セットアップ
- チャートにインジケーターを追加
- 構造分析のための好みの高いタイムフレームを設定
- 取引スタイルに合わせて色やスタイルをカスタマイズ
- リアルタイム通知のためにアラートを有効化
- プロの市場構造インサイトで取引を開始
💡 トレーディング応用
- トレンドフォロー: BOSシグナルを使ってトレンドに沿ったポジションを取る
- リバーサルトレード: MSSシグナルで潜在的なトレンド変化を警告
- ブレイクアウト確認: 構造分析でブレイクアウトトレードを検証
- マーケットコンテキスト: 市場全体の構造を一目で理解
2025年12月31日まで無料です、お楽しみください!!!
インジケーターのプロフィール
0.0
レビュー: 0
カスタマーレビュー
この商品にはまだレビューがありません。お使いになったことがある方は、ぜひレビューをお願いします。
Signal
Breakout
SMC
cTrader Storeで入手可能な取引ボット、インジケーター、プラグインなどの商品は、第三者の開発者が提供するものであり、情報と技術の取得のみを目的としてご利用いただけます。cTrader Storeはブローカーではなく、投資助言や個人的な推奨を行うことも、将来のパフォーマンスを保証することもありません。
この作成者の他の商品


10M
取引数量
10.64K
獲得pips
22
販売
1.2K
無料インストール