
الوصف
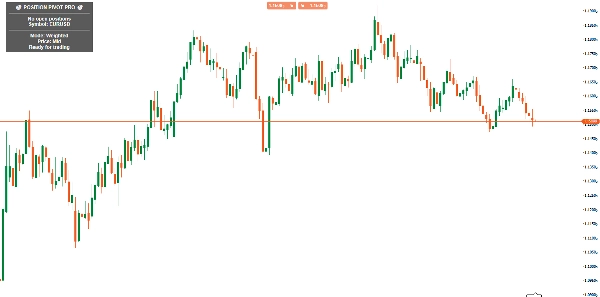
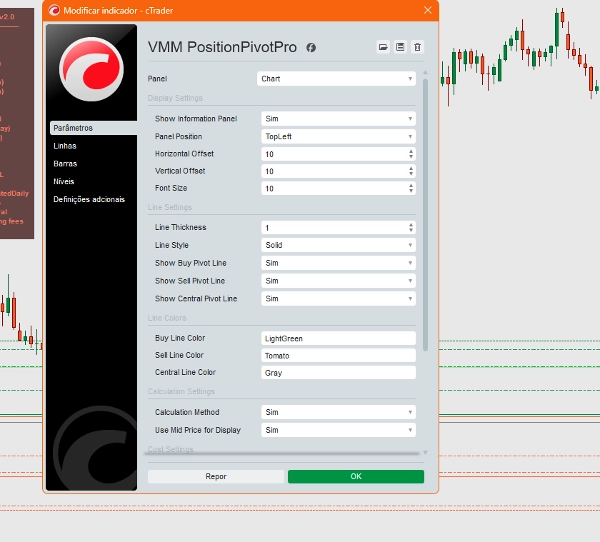
Position Pivot Pro هي أداة متقدمة لإدارة المراكز مصممة للمتداولين الذين يفتحون مداخل متعددة على نفس الأصل. يقوم المؤشر بحساب متوسط نقطة المحور لكل المراكز المفتوحة تلقائيًا، مما يوفر مرجعًا بصريًا حيويًا على الرسم البياني.
الميزات الرئيسية:
- حساب المحور في الوقت الحقيقي:
-
- المتوسط البسيط: المتوسط الحسابي لأسعار الدخول
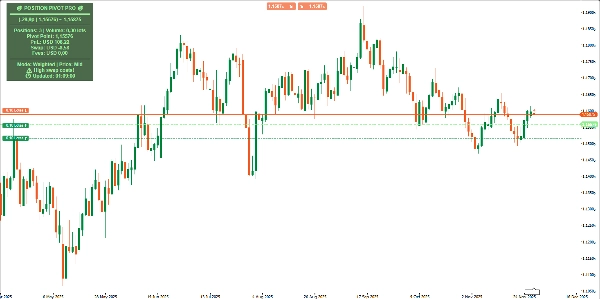
- المتوسط المرجح بالحجم: (افتراضي) يأخذ في الاعتبار حجم كل مركز للحصول على محاور أكثر دقة
- خط الرسم البياني الديناميكي الذي يتكيف تلقائيًا
- لوحة معلومات كاملة:
-
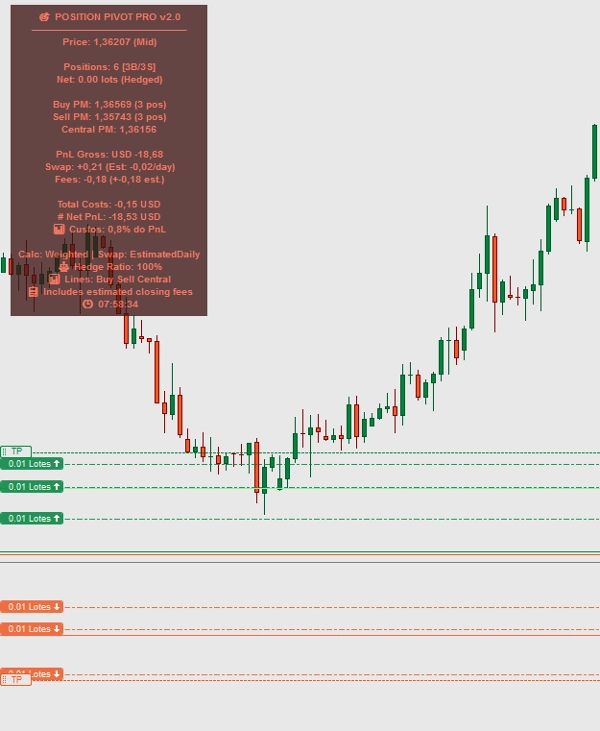
- يعرض نقطة المحور المحسوبة
- يظهر قوة الحركة بالنقاط (المسافة من السعر الحالي)
- إجمالي المراكز والحجم باللوتات
- الأرباح والخسائر غير المحققة، الفائدة المتراكمة، والعمولات الإجمالية
- نظام تنبيه التكاليف:
-
- تنبيهات بصرية عند تجاوز العمولات أو الفائدة للحدود القابلة للتكوين
- تحذيرات للتكاليف المطلقة العالية
- ألوان ديناميكية (أخضر/ربح، أحمر/خسارة، محايد)
- الخصائص التقنية:
-
- عدم التأخير: حسابات في الوقت الحقيقي بدون تأخيرات
- قابلية التخصيص الكاملة: موقع اللوحة، الألوان، سمك الخط
- وضع سعر الوسط/العطاء: اختيار مرجع الحساب
- تحديثات تلقائية مع تغييرات المراكز
فوائد المتداول:
- اتخاذ قرارات أسرع من خلال عرض موحد لجميع المراكز
- تحسين إدارة المخاطر عن طريق تحديد نقاط التعادل
- تحسين التكاليف من خلال مراقبة الفائدة والعمولات
- تحليل قوة الحركة بالنسبة لنقطة المحور
حالات الاستخدام:
- التدرج في الدخول/الخروج: تحديد متوسط السعر المثالي لإضافة أو تقليل المراكز
- إدارة التحوط: مراقبة المراكز المعاكسة في نفس الوقت
- تداول الاتجاه: تتبع تطور المداخل التدريجية
- التداول اليومي: التحكم الدقيق في عدة صفقات داخل اليوم
مثالي للمتداولين الذين يستخدمون استراتيجيات التدرج، المارتينجال، أو الدخول المتعدد، حيث يحول البيانات المعقدة إلى معلومات قابلة للتنفيذ مباشرة على الرسم البياني.
الملخص
ملف تعريف المؤشر
تقييمات العملاء
0.0
التقييمات: 0
تقييمات العملاء
لا توجد تقييمات لهذا المنتج حتى الآن. هل جرَّبته بالفعل؟ كن أول من يخبر الآخرين!
مناقشة
الأسئلة الشائعة
BTCUSD
Forex
Indices
EURUSD
Commodities
GBPUSD
NZDUSD
Crypto
Stocks
XAUUSD
NAS100
USDJPY
يتم توفير المنتجات المتاحة من خلال cTrader Store، بما في ذلك روبوتات التداول والمؤشرات والإضافات، من قبل مطوري الطرف الثالث وإتاحتها لأغراض الوصول المعلوماتي والفني فقط. cTrader Store ليس وسيطًا ولا يقدم نصائح استثمارية أو توصيات شخصية أو أي ضمان للأداء المستقبلي.
المزيد من هذا المؤلف


قد يعجبك أيضًا


السعر
منذ 28/12/2024
54
التثبيتات المجانية