
Opis
Ten wskaźnik cTrader identyfikuje i wizualizuje pierwsze specyficzne nierównowagi rynkowe, które występują podczas trzech głównych sesji handlowych w Nowym Jorku. Został zaprojektowany dla praktyków ICT (Inner Circle Trader), którzy koncentrują się na "pierwszych przedstawionych" ustawieniach jako wysokoprawdopodobnych śladach instytucjonalnych.
核心 (Core) Funkcjonalność
Wskaźnik monitoruje rynek od otwarcia każdej sesji i "blokuje" bardzo pierwszą nierównowagę, którą znajdzie. Po narysowaniu typu nierównowagi (takiego jak FVG) dla konkretnej sesji, nie narysuje kolejnej tego samego typu aż do rozpoczęcia następnej sesji.
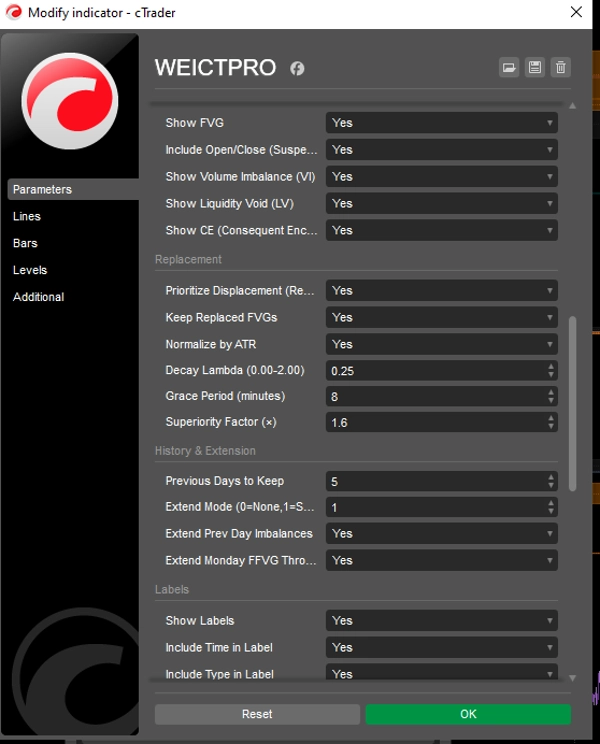
1. Wykryte typy nierównowagi
- Fair Value Gap (FVG): Struktura trzech świec, gdzie knot pierwszej i knot trzeciej świecy nie nachodzą na siebie, pozostawiając "lukę" w zakresie cen drugiej świecy.
- Volume Imbalance (VI): Występuje, gdy istnieje luka między korpusami (otwarcie/zamknięcie) dwóch kolejnych świec, nawet jeśli knoty nachodzą na siebie.
- Liquidity Void (LV): Bardziej ekstremalna luka, gdzie nie ma żadnej aktywności cenowej pomiędzy knotami dwóch kolejnych świec (całkowity "skok" ceny).
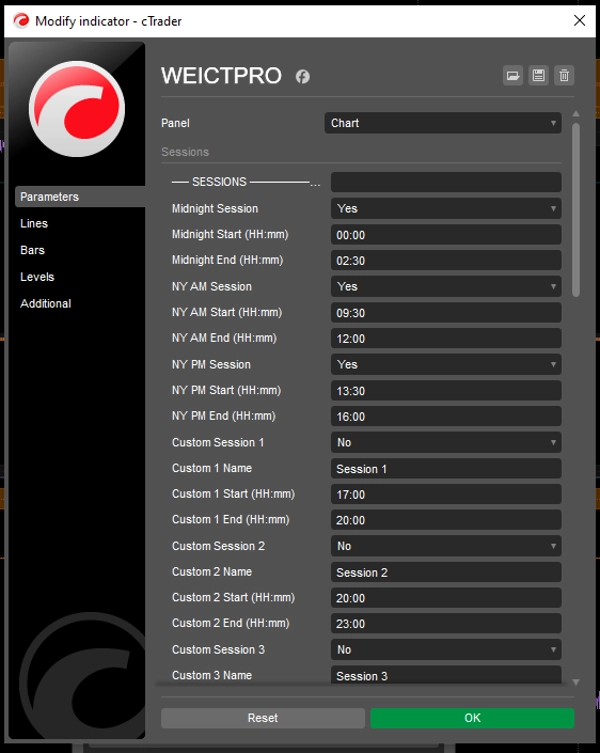
2. Monitorowane sesje (czas nowojorski)
Wskaźnik automatycznie konwertuje czas wykresu na czas wschodni (ET), aby śledzić:
- Północ: 00:00 – 02:30
- NY AM: 09:30 – 12:00
- NY PM: 13:30 – 16:00
Funkcje wizualne
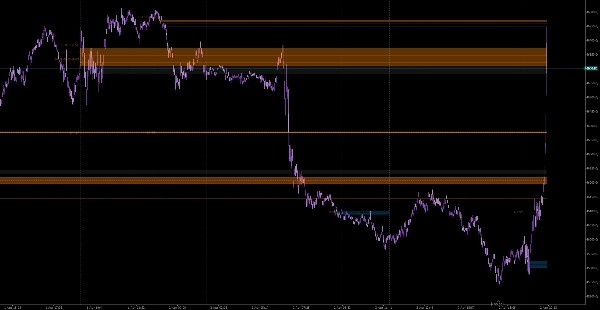
- Dynamiczne rozszerzenie: Ramki są rysowane od punktu początkowego i automatycznie rozszerzają się do przodu o zdefiniowaną przez użytkownika liczbę słupków (
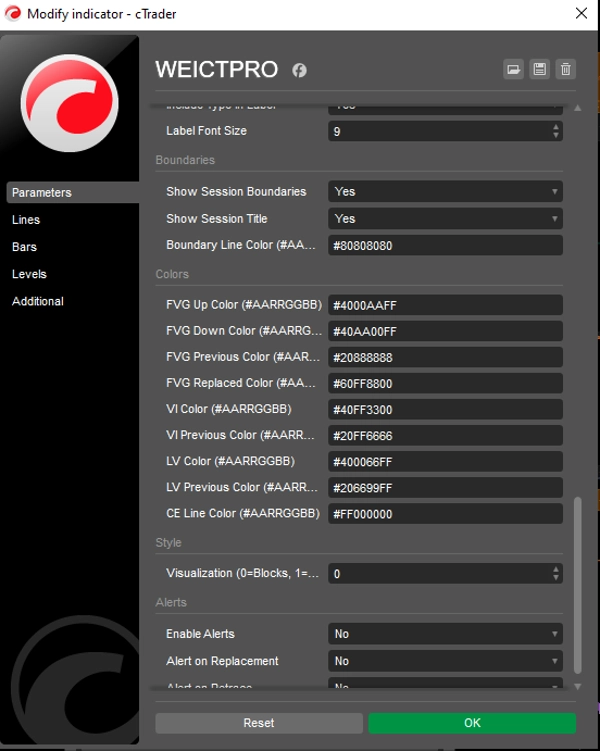
Extend Bars), aby pokazać potencjalne przyszłe wsparcie/opór. - Konsekwentne naruszenie (CE): Rysuje przerywaną linię środkową przez nierównowagę. W teorii ICT poziom 50% (CE) jest krytycznym punktem odniesienia instytucjonalnego.
- Automatyczne etykietowanie: Wyraźnie oznacza każdą ramkę nazwą sesji i typem nierównowagi (np. "NY AM +FVG").
Kluczowe parametry
Parametr
Opis
Pokaż FVG/VI/LV
Przełącz, które konkretne typy nierównowagi chcesz śledzić.
Przezroczystość ramki
Reguluje, jak "solidne" wydają się zacienione obszary na twoim wykresie.
Rozszerzenie słupków
Ile świec w przyszłość ma być rzutowana ramka.
Strefa czasowa
Na stałe ustawiona na Eastern Standard Time, aby zapewnić dokładność sesji niezależnie od czasu serwera twojego brokera.
Rekomendacje techniczne
- Interwały czasowe: Najlepiej używać na M1 do M15. Na wyższych interwałach (H1+) sesje są zbyt krótkie, aby wiarygodnie uchwycić "pierwszą" przedstawioną nierównowagę.
- Zastosowanie: Te obszary często działają jak "magnesy" dla ceny. Traderzy szukają powrotu ceny do tych ramek (szczególnie poziomu CE) na wejścia, zanim kontynuują w oryginalnym kierunku.
Podsumowanie
The indicator detects three imbalance types: Fair Value Gap (FVG), a three-candle gap where the first and third candle wicks do not overlap; Volume Imbalance (VI), a gap between the bodies of two consecutive candles; and Liquidity Void (LV), a total price jump with no price action between consecutive candle wicks. Once an imbalance type is identified in a session, it locks and does not redraw until the next session.
Visual features include dynamically extending boxes from the imbalance origin for a user-defined number of bars, a dashed midline marking the 50% level (Consequent Encroachment), and automated labeling with session and imbalance type. The indicator is hardcoded to Eastern Time for session accuracy and is best used on M1 to M15 timeframes to reliably capture the first imbalance. Users can toggle imbalance types, adjust box opacity, and set extension length. This tool supports multiple markets including Forex, indices, commodities, stocks, and cryptocurrencies.


