
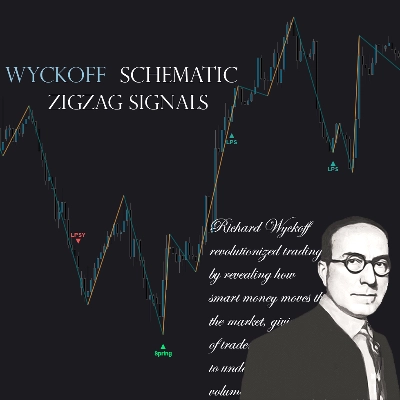
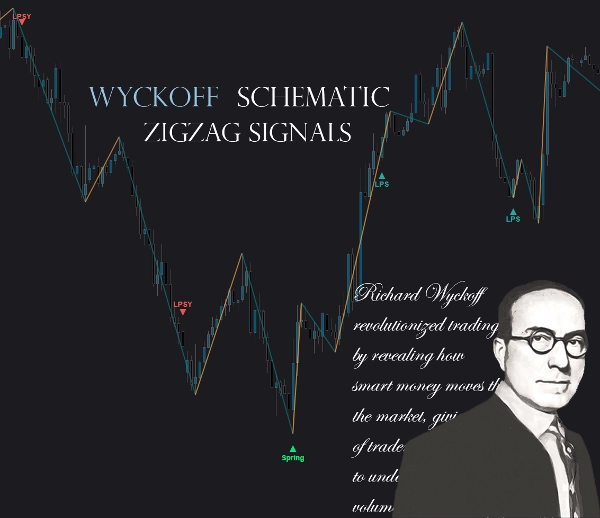
Wyckoff Schematic ZIGZAG Signals
Wskaźnik
Wersja 1.0, May 2026
Windows, Mac

625.93M
Wolumen transakcji
3.57M
Zysk w pipsach
24
Sprzedaż
Opis
The Wyckoff Schematic Indicator
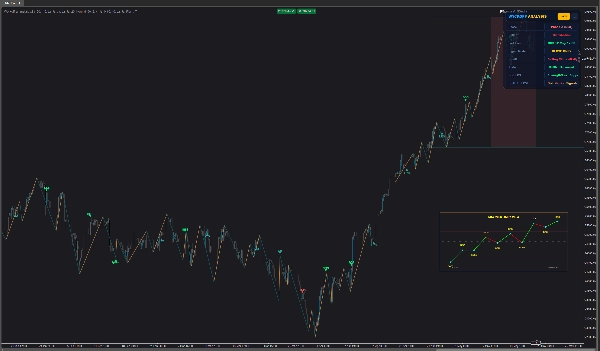
is a professional-grade market structure tool that automates the identification and visualization of Wyckoff accumulation and distribution logic. It translates raw price and volume data into a structured institutional-style market map.
Core Functionality
- Automatically detects Wyckoff market phases (A–E) for both accumulation and distribution
- Identifies key structural events such as:
- Selling Climax (SC)
- Automatic Rally (AR)
- Secondary Tests (ST)
- Springs & Upthrusts
- Signs of Strength (SOS)
- Last Points of Support (LPS)
- Buying Climax (BC)
- Upthrust After Distribution (UTAD)
- Last Point of Supply (LPSY)
Market Structure & Logic
- Uses volume spikes vs. moving average volume to detect institutional activity
- Combines:
- Price range compression/expansion
- Swing high/low structure
- Mid-range equilibrium zones
- Dynamically calculates:
- Support levels
- Resistance levels
- Mid-range market equilibrium
Visual Analysis Tools
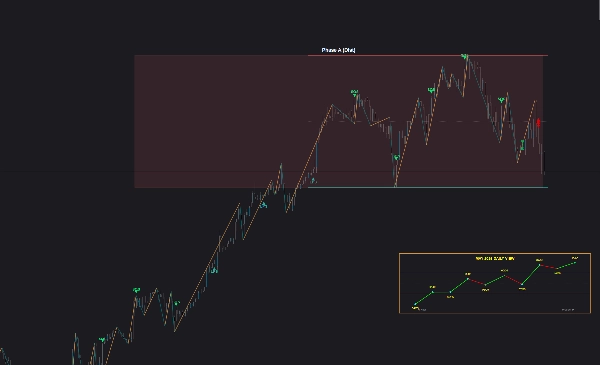
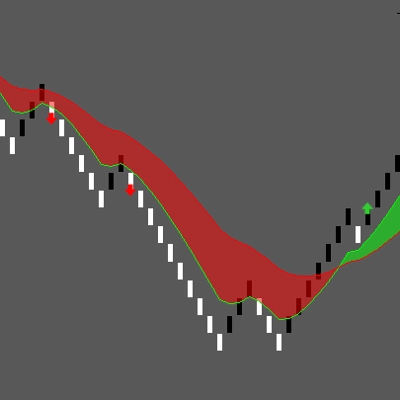
- Real-time phase boxes (A–E cycles) directly on chart
- Clear labeling of Wyckoff events with directional markers
- Built-in zigzag structure for swing clarity
- Color-coded phases for instant visual interpretation
- Optional higher-level wave overlay for broader market context
Advanced Features
- Fully automated detection engine (no manual drawing required)
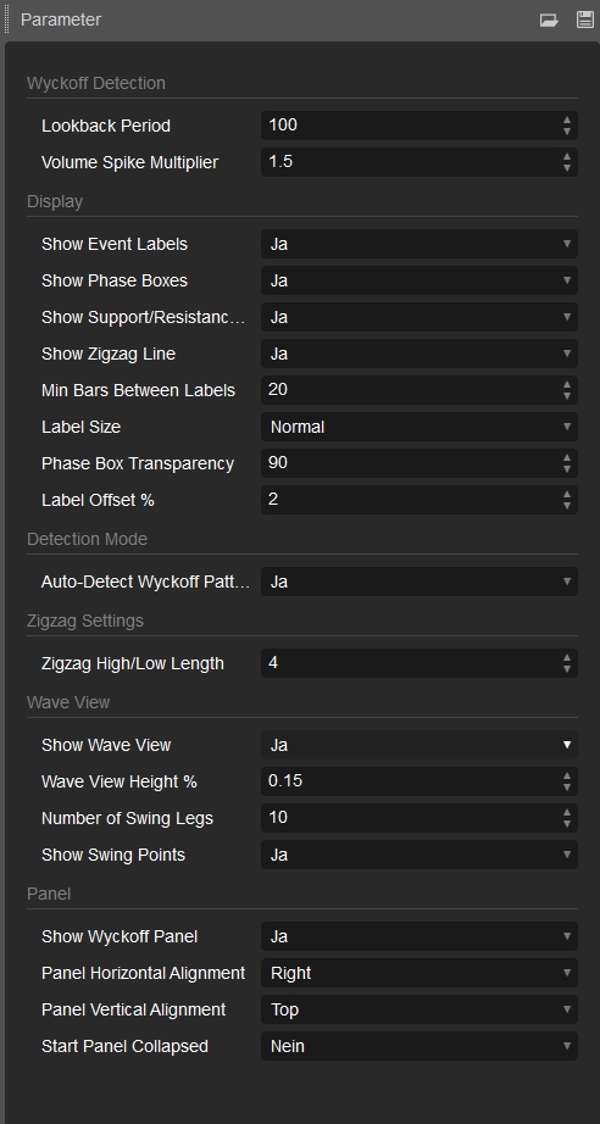
- Adaptive sensitivity based on lookback period and volume multiplier
- Filters to reduce noise and avoid over-signaling
- Minimum-bar logic to prevent cluttered labeling
- Real-time recalculation on each closed bar
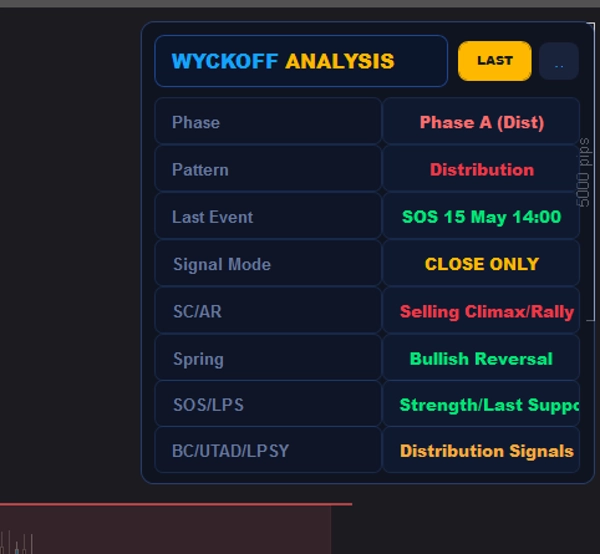
Professional Dashboard Panel
- Live Wyckoff state overview:
- Current phase (Accumulation / Distribution)
- Detected pattern (Spring, SOS, LPS, etc.)
- Last market event with timestamp
- Signal mode display (close-based logic)
- Color-coded status badge for quick interpretation
- Collapsible UI panel for clean chart experience
Target Use Case
This indicator is designed for traders who focus on:
- Smart Money Concepts (SMC)
- Wyckoff methodology
- Volume-price analysis
- Institutional order flow interpretation
It provides a structured, rule-based interpretation of market behavior, removing subjective chart reading and replacing it with systematic phase detection.
Podsumowanie
Profil wskaźnika
Kategoria wskaźnika
Formacja
Typ wyjścia
Wizualizacja
Sygnały
Wymagania dotyczące danych
Tylko słupki
Wolumen
Obsługiwane sygnały
Odwrócenie trendu
Przełamanie
Dotknięcie poziomu
Przebicie poziomu
Dyskusja
Opinie klientów
0.0
Opinie: 0
Opinie klientów
Ten produkt nie ma jeszcze opinii. Wypróbowałeś(-aś) go już? Bądź pierwszy(-a) i powiedz o tym innym!
Częste pytania
Premium/Discount
Supertrend
Volume
Market Structure
Supply & Demand
Support & Resistance
Produkty dostępne za pośrednictwem cTrader Store, w tym boty handlowe, wskaźniki i wtyczki, dostarczane są przez deweloperów zewnętrznych i udostępniane wyłącznie w celach informacyjnych oraz w celu zapewnienia dostępu technicznego. cTrader Store nie jest brokerem i nie zapewnia doradztwa inwestycyjnego, nie udziela spersonalizowanych rekomendacji ani nie gwarantuje przyszłych wyników.












Cena
625.93M
Wolumen transakcji
3.57M
Zysk w pipsach
24
Sprzedaż