present
Daftar dan dapatkan diskon $50 untuk pembelian pertama Anda
Trading product for RegimeVisualizer Indikator Flag Volume, image 1
RegimeVisualizer
Indikator
Versi 1.0, Jul 2026
Windows, Mac
Trading product for RegimeVisualizer Indikator Flag Volume, image 2
Trading product for RegimeVisualizer Indikator Flag Volume, image 3
Trading product for RegimeVisualizer Indikator Flag Volume, image 4
Trading product for RegimeVisualizer Indikator Flag Volume, image 5
Sejak 11/01/2025
14.87M
Volume trading
1.06M
Pip dimenangkan

Deskripsi

The problem with regime indicators: they change their minds.

Most regime indicators "learn" from the data while they run. You know the result: the history looks beautiful, because the labels of past bars were silently rewritten after the future arrived. This has a name β€” repainting β€” and it is the cardinal sin of any analysis tool: it looks reliable precisely because it erases its own mistakes.

Regime Visualizer makes a single promise: it never repaints.

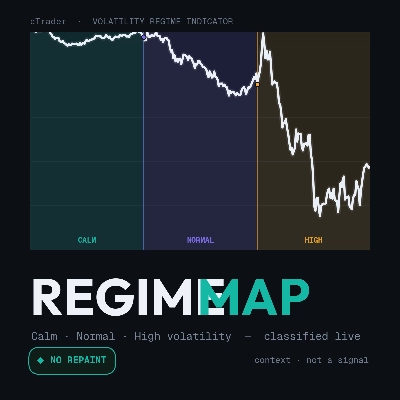
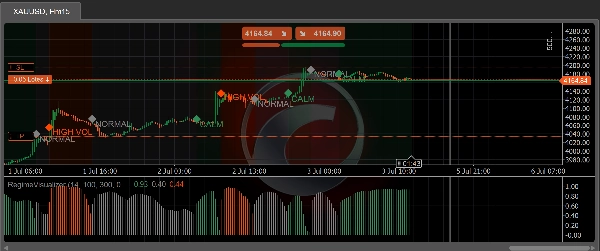
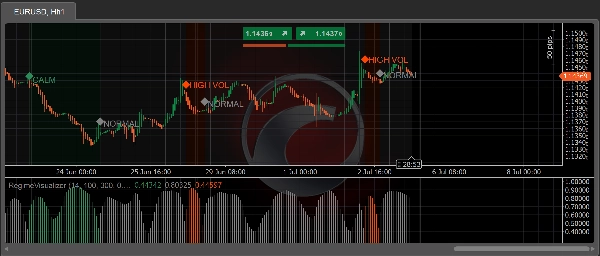
Every bar is classified into one of three volatility regimes β€” Calm, Normal or High β€” at the moment it closes. That label is final. It is never recalculated, smoothed or retroactively corrected. The screenshot you take today shows the same thing that was on the screen live, bar by bar. Deterministic: same data, same picture, on every run.

What you see on the chart:

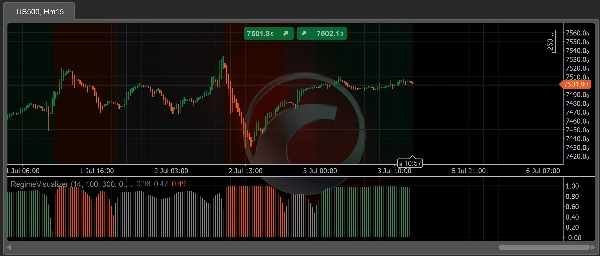
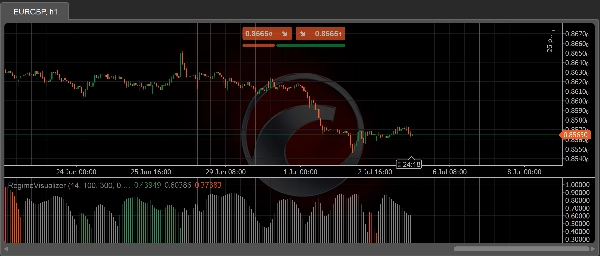
  • 🎨 Colored background per regime segment, right on the price chart
  • πŸ“Š Confidence histogram (0–1) in a separate panel β€” the filtered probability of the active regime, in the regime's color
  • πŸ”· Transition marker β€” icon + label on the bar where the regime changes
  • Each layer toggles on/off independently, with configurable colors

What it is NOT (read before installing):

  • ❌ Not a trading signal. It never tells you to buy or sell.
  • ❌ No performance promise. Volatility regime does not predict profit β€” this indicator makes context readable, nothing more. What you do with it is your responsibility.
  • ❌ Not adaptive. There is no online learning β€” on purpose: "learning while running" is exactly what makes regime indicators repaint.

How it works (for those who want to know):

A 3-state hidden Markov model (HMM) with fixed parameters runs on normalized ATR (ATR(14) / 100-bar ATR average β€” dimensionless, so it works on any instrument and timeframe). Inference is forward filtering only β€” it uses nothing but data up to the close of the current bar, with no Viterbi and no backward smoothing (the classic sources of repainting). A hysteresis layer with thresholds and a minimum dwell time turns the flickering argmax into a stable read.

Honest about its limits:

  • The first 300 bars (warmup) stay unlabeled β€” the indicator does not pretend to know what it does not know yet.
  • The forming bar gets no label β€” it is classified when it closes. That is the price of never repainting, and we pay it in front of you.

For cBot developers:

The indicator exposes the public RegimeCode series (0 = Calm, 1 = Normal, 2 = High, βˆ’1 = warmup) for consumption via Indicators.GetIndicator<RegimeVisualizer>(). Non-repainting volatility context, ready to plug into your logic.

Validation (tested, not claimed):

The non-repaint property was verified by a harness that reprocessed 100,000 real bars across 201 incremental windows β€” 10.1 million label comparisons, zero divergence β€” plus bit-identical determinism across runs.

Free. Context β€” not a signal.

Ringkasan

Profil indikator
Kategori indikator
Volume
Tipe output
Visualisasi
Persyaratan data
Hanya batang
Sinyal yang didukung
Volatilitas

Diskusi

Ulasan pelanggan

0.0
Ulasan: 0
Ulasan pelanggan
Belum ada ulasan untuk produk ini. Sudah mencobanya? Jadilah pemberi ulasan pertama!

Pertanyaan umum

Flag
Volume
Market Structure
Supply & Demand
Risk Dashboard
ATR
Liquidity Grab
Produk-produk yang tersedia melalui cTrader Store, termasuk bot trading, indikator, dan plugin, disediakan oleh pengembang pihak ketiga serta hanya ditujukan untuk akses teknis dan informasi. cTrader Store bukan broker dan tidak menyediakan saran investasi, rekomendasi pribadi, atau jaminan apa pun tentang kinerja di masa mendatang.

Anda mungkin juga suka

Indikator
Bollinger Bands
Keltner Channels
Professional squeeze momentum indicator detecting volatility compression and breakout opportunities with color-coded sig
Indikator
ATR
EMA
+5
Candle timer with live profit tracking on chart – displays pips, currency value, and percentage in real time.
Indikator
Drawdown Monitor
Protect your funded account. Real-time Daily Equity Drawdown monitor with Green / Orange / Red flashing alerts.
Indikator
show symbol and time fram, daily net profit percent, daily net profit, and spread ln your chart. consider that timezone
Indikator
MACD
Prop
+8
NTNPICLL is a tool to check the best trading hours for the assets and also includes the highest and lowest point
Indikator
AI
SMC
+5
Complete ICT Killzones: 5 sessions, easy colors, transparency controls & session info. Professional timing for cTrader.
Indikator
BOS
MSS
+3
Advanced indicator to highlight key execution context and help aligning structure, location, and risk.
Indikator
AI
ATR
+27
COT Flows. Clear Direction. 🧭
Indikator
Smart Signal Reversal Trend + Patterns
Indikator
RSI
Breakout
+1
πŸ” Automatically detect support and resistance levels based on "swings" or pivots
Indikator
Breakout
Allow trader to visualize Support & Resistance across different timeframes,give trader an overview of the current market
Indikator
SMC
Forex
+5
Detect institutional breakout zones with smart volume & channel analysis β€” by PrimeQuant.
Indikator
VWAP
Volume
+5
Multi VWAP. Three timeframes. One clean chart. Your Essential Trading Tool.
Logo "Cross EMA Pro"
Peringkat teratas
4.4
(5)
$49
Indikator
Forex
BTCUSD
+5
Cross EMA Pro – Trend Reversal Indicator
Indikator
ADX
ATR
+5
Configure, simulate, and analyze trading strategies with custom filters, multi-target exits, and detailed performance me
Indikator
Forex
EURUSD
+7
Institutional Session Levels Pro OHLC,Prev(D,W,M OHLC)
Indikator
ADX
ATR
+5
Precision Sniper by PrimeQuant: Advanced confluence engine with auto-presets, dynamic TP/SL, and live backtest stats.
Indikator
BOS
Fair Value Gap
+1
ICT Quarterly Theory indicator Ҁ” color-coded Q1Ҁ“Q4 session zones with smart entry signals and real-time alerts.

Harga

Sejak 11/01/2025
14.87M
Volume trading
1.06M
Pip dimenangkan