
Deskripsi
Apa itu LTtradingBox?
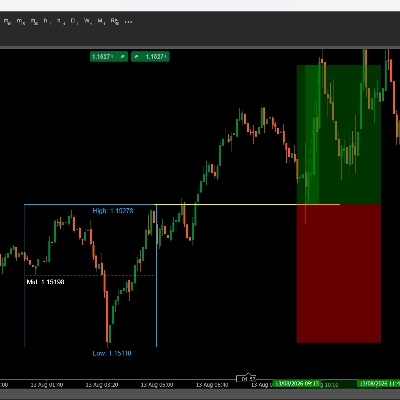
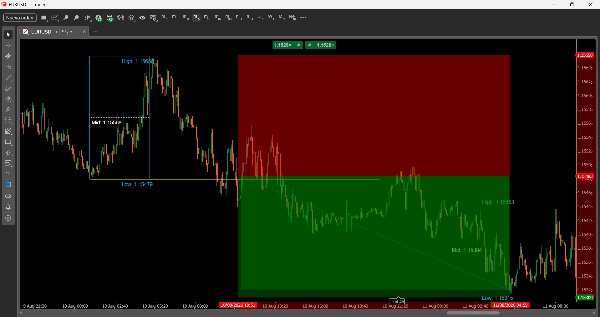
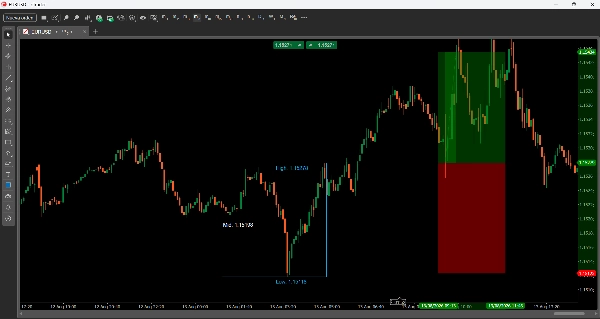
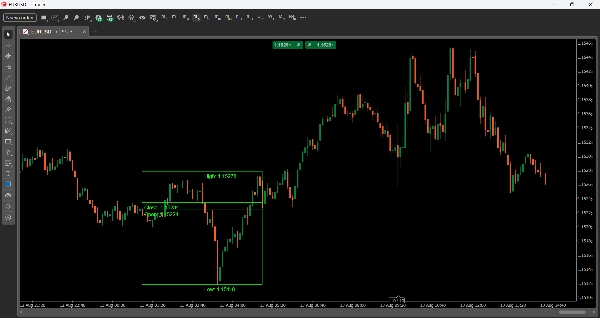
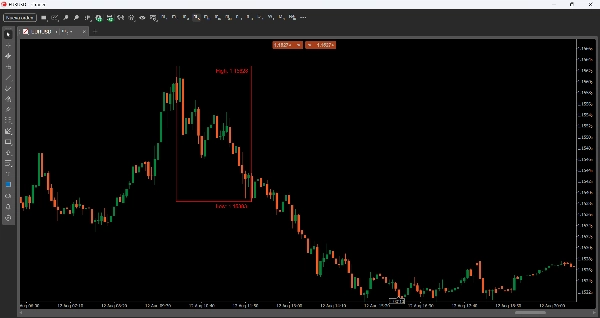
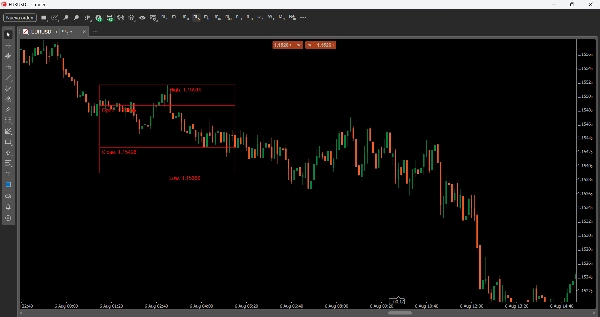
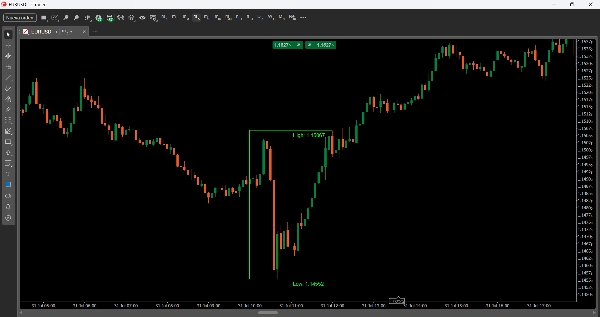
LTtradingBox secara visual menandai rentang harga (tinggi, rendah, buka, dan tutup) dari jendela waktu yang Anda tentukan — misalnya sesi London atau New York. Kotak ini secara otomatis mengubah warna berdasarkan hasil sesi tersebut: hijau jika ditutup bullish, merah jika ditutup bearish, abu-abu jika netral (atau warna apa pun yang Anda pilih untuk setiap kasus). Ini juga menambahkan garis referensi (Harga Tengah, Waktu Tengah) dan isian visual opsional, membantu Anda melihat zona likuiditas, rentang akumulasi, dan level kunci untuk diperdagangkan dengan sekilas.
Parameter
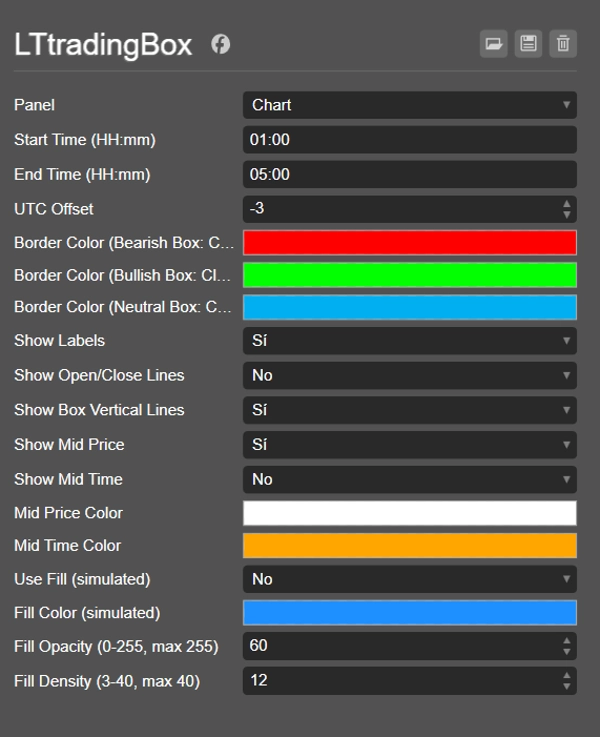
Pengaturan Waktu
- Waktu Mulai (HH:mm) — Waktu mulai kotak (format 24 jam).
- Waktu Selesai (HH:mm) — Waktu selesai kotak.
- Offset UTC — Penyesuaian waktu agar kotak sesuai dengan waktu lokal Anda atau sesi yang ingin Anda lacak (misalnya London, NY, Asia), terlepas dari zona waktu broker Anda.
Warna
- Warna Border (Kotak Bearish: Tutup < Buka) — Warna border saat kotak ditutup bearish.
- Warna Border (Kotak Bullish: Tutup > Buka) — Warna border saat kotak ditutup bullish.
- Warna Border (Kotak Netral: Tutup == Buka) — Warna border saat tutup sama dengan buka.
Opsi Tampilan
- Tampilkan Label — Mengaktifkan label teks yang menunjukkan nilai Tinggi, Rendah, Buka, dan Tutup.
- Tampilkan Garis Buka/Tutup — Menggambar garis horizontal yang menandai harga buka dan tutup dalam kotak.
- Tampilkan Garis Vertikal Kotak — Mengaktifkan persegi panjang penuh (4 border); jika dinonaktifkan, hanya garis Tinggi dan Rendah yang ditampilkan.
- Tampilkan Harga Tengah — Menggambar garis putus-putus di titik tengah antara Tinggi dan Rendah.
- Tampilkan Waktu Tengah — Menggambar garis vertikal di titik tengah waktu kotak.
- Warna Harga Tengah / Warna Waktu Tengah — Warna yang dapat disesuaikan untuk garis-garis tersebut.
Isian (isian visual)
- Gunakan Isian (simulasi) — Mengaktifkan isian simulasi di dalam kotak (menggunakan garis tipis yang ditumpuk).
- Warna Isian (simulasi) — Warna isian.
- Opasitas Isian (0-255, maksimal 255) — Tingkat transparansi isian.
- Kepadatan Isian (3-40, maksimal 40) — Jumlah garis yang digunakan untuk mensimulasikan isian (kepadatan lebih tinggi = isian lebih padat).
Ide Trading
- Breakout dan retest: tunggu harga menembus Tinggi atau Rendah kotak, lalu kembali untuk mengetes ulang level tersebut sebagai support/resistance sebelum masuk sesuai arah breakout.
- Pembalikan di ekstrem: jika harga menyentuh Tinggi atau Rendah kotak tanpa menembus dengan kekuatan, ini bisa menandakan penolakan dan pergerakan ke sisi berlawanan kotak.
- Bias arah berdasarkan sesi: warna kotak memberi Anda bias cepat (bullish/bearish/netral) tentang bagaimana sesi tersebut bergerak, berguna untuk menyelaraskan entri di sesi berikutnya.
- Harga Tengah sebagai magnet: titik tengah sering bertindak sebagai zona penyeimbangan — cari entri saat harga kembali ke Tengah setelah pergerakan impulsif yang kuat.
- Bandingkan kotak berturut-turut: karena setiap kotak harian disimpan (melalui tag tanggalnya), Anda dapat membandingkan rentang dan bias beberapa sesi berturut-turut untuk melihat tren jangka pendek.
Ringkasan
Ringkasan AI
LTtradingBox is a customizable trading indicator that visually highlights the price range—high, low, open, and close—within any user-defined time window, such as a specific trading session. The indicator draws a colored box representing this range, automatically changing its border color to green for bullish closes, red for bearish closes, or gray for neutral, with customizable color options. It includes reference lines for the midpoint price and midpoint time, which can be displayed as dotted or vertical lines, aiding in identifying liquidity zones, accumulation areas, and key support/resistance levels.
Users can configure start and end times, apply a UTC offset to align with local or session times, and toggle display options such as labels for price points, open/close lines, full box borders, and visual fills with adjustable color, opacity, and density. The indicator supports trading strategies including breakout and retest of box boundaries, reversal signals at extremes, session-based directional bias, and using the midpoint as a rebalancing zone. It also allows comparison of consecutive session boxes to detect short-term trends. LTtradingBox is designed to assist traders in quickly identifying key levels and market structure within chosen timeframes.
Users can configure start and end times, apply a UTC offset to align with local or session times, and toggle display options such as labels for price points, open/close lines, full box borders, and visual fills with adjustable color, opacity, and density. The indicator supports trading strategies including breakout and retest of box boundaries, reversal signals at extremes, session-based directional bias, and using the midpoint as a rebalancing zone. It also allows comparison of consecutive session boxes to detect short-term trends. LTtradingBox is designed to assist traders in quickly identifying key levels and market structure within chosen timeframes.
Profil indikator
Kategori indikator
Support & resistance
Tipe output
Visualisasi
Persyaratan data
Hanya batang
Sinyal yang didukung
Breakout
Reversal
Level tertembus
Level tersentuh
Ulasan pelanggan
0.0
Ulasan: 0
Ulasan pelanggan
Belum ada ulasan untuk produk ini. Sudah mencobanya? Jadilah pemberi ulasan pertama!
Diskusi
Pertanyaan umum
Key Levels
Support & Resistance
Produk-produk yang tersedia melalui cTrader Store, termasuk bot trading, indikator, dan plugin, disediakan oleh pengembang pihak ketiga serta hanya ditujukan untuk akses teknis dan informasi. cTrader Store bukan broker dan tidak menyediakan saran investasi, rekomendasi pribadi, atau jaminan apa pun tentang kinerja di masa mendatang.


















Harga
Sejak 10/01/2025