present
Daftar dan dapatkan diskon $50 untuk pembelian pertama Anda
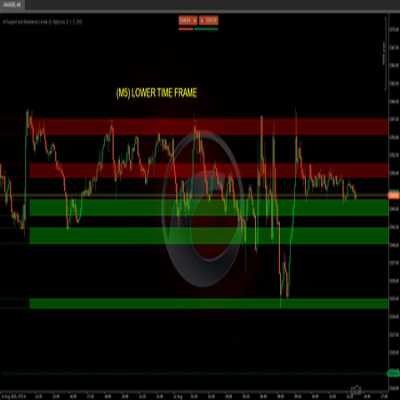
Trading product for PulseFlow Imbalance Sessions and ADR Indikator Fair Value Gap Key Levels, image 1
PulseFlow Imbalance Sessions and ADR
Indikator
Versi 1.0, Oct 2026
Windows, Mac
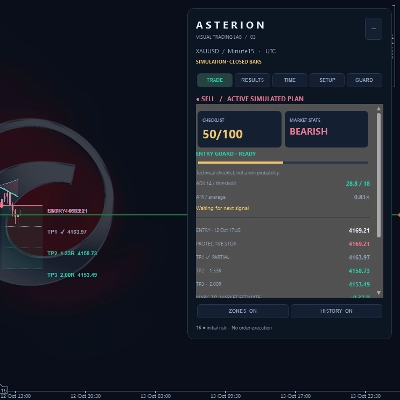
Trading product for PulseFlow Imbalance Sessions and ADR Indikator Fair Value Gap Key Levels, image 2
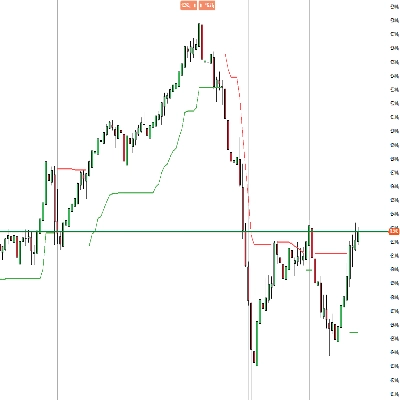
Trading product for PulseFlow Imbalance Sessions and ADR Indikator Fair Value Gap Key Levels, image 3
Trading product for PulseFlow Imbalance Sessions and ADR Indikator Fair Value Gap Key Levels, image 4
Sejak 14/10/2026

Deskripsi

Launch price: $19 until November 14, 2026. After that date, the price returns to $33.

A clean chart, with nothing important hiding on the left


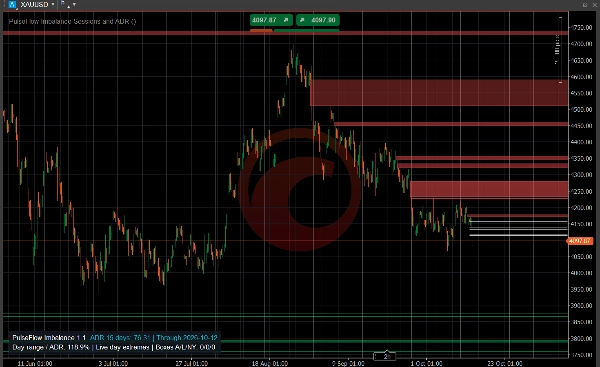
PulseFlow Imbalance Sessions and ADR keeps the structure that matters in front of you: open imbalance zones (fair value gaps), untouched session highs and lows, and how far the day has travelled against its average range. You read the chart at a glance, without dragging it back in time. It helps you make better decisions with clear references.


The zone you needed, lost to the left

A fast move leaves an imbalance behind. By the time price comes back, it can be far off screen, and you wonder whether it was ever filled. Here, open zones stay in view until price fills them.


Only what is still open

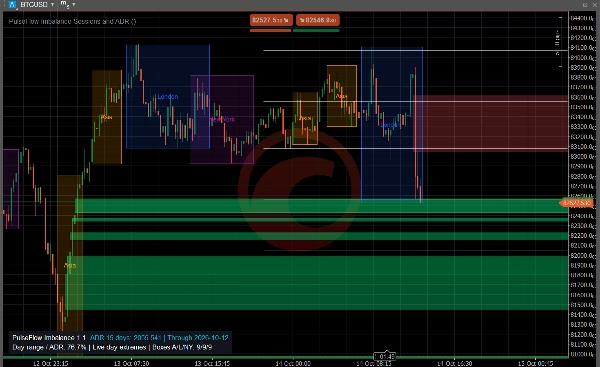
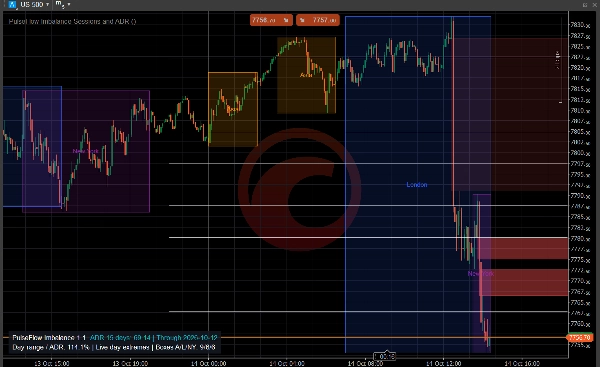
- Bullish zones in green, bearish zones in red, extended to the right.

- Gaps that are small compared with the average daily range (ADR) are ignored, so only meaningful zones are drawn.

- A zone shrinks live as price trades back into it and disappears once it is completely filled.

- The shade of each zone shows the volume behind the move that created it: darker when volume was low, brighter when it was high. Volume comes from cTrader tick volume.


The map of the day

- Boxes mark the Asia (Tokyo), London and New York sessions, each in its own colour.

- Dotted lines stay at the high and low of each finished session until price touches them.

- ADR projections at 50%, 75% and 100% of the average daily range, measured from the day's low and high or from the day open, show how much room the day has used.

- A compact panel shows the current ADR and the share of it the day has already covered.


Then the reading is yours

Watch what price does when it returns to an open zone or a session level: pause, rejection or a full fill. Optional cTrader pop-up alerts tell you about new imbalances, large imbalances relative to the ADR, first touches, partial fills and complete fills, so you can step away from the screen.


Type, instruments and timeframes

Chart overlay indicator for market structure: imbalance zones, session levels and daily range projections. It works on any market with candles, such as stock indices, forex, gold and cryptocurrencies. Imbalance zones work on all standard time-based charts. Session boxes need an intraday chart and read best up to the 1-hour chart. ADR projections are available on intraday and daily charts. Tick, Renko, range and Heikin Ashi charts are not supported.


Keep in mind

Zones are drawn when the third candle closes, after the move, never ahead of it. Sessions are clock windows without a holiday calendar and can be switched off. The ADR is an average of completed days, not a limit price must respect. Zones and levels are references, not entries, stops or targets, and price may ignore any of them.


Trading involves risk. Past performance does not guarantee future results.

Ringkasan

Profil indikator
Kategori indikator
Struktur pasar (SMC)
Tipe output
Visualisasi
Persyaratan data
Hanya batang
Sinyal yang didukung
Level tersentuh

Diskusi

Ulasan pelanggan

0.0
Ulasan: 0
Ulasan pelanggan
Belum ada ulasan untuk produk ini. Sudah mencobanya? Jadilah pemberi ulasan pertama!

Pertanyaan umum

Fair Value Gap
Key Levels
Imbalance
Produk-produk yang tersedia melalui cTrader Store, termasuk bot trading, indikator, dan plugin, disediakan oleh pengembang pihak ketiga serta hanya ditujukan untuk akses teknis dan informasi. cTrader Store bukan broker dan tidak menyediakan saran investasi, rekomendasi pribadi, atau jaminan apa pun tentang kinerja di masa mendatang.

Produk lain dari penulis ini

Indikator
RSI
Fibonacci
+1
Spot RSI divergences on your chart and get an entry, stop and six targets when your filters line up.
Indikator
Key Levels
Market Structure
+1
See the day's percentage targets from the open, so you know where the session stands at a glance.
Indikator
Key Levels
Support & Resistance
Add your provider's gamma levels by hand or automatically with our feed plugin, and see the gamma regime at a glance.
Plugin desktop
External Data
HTTP Requests
Load live gamma levels from your own QuantWheel API key into PulseFlow Gamma Regime, with no more typing by hand.

Anda mungkin juga suka

Indikator
ATR
Forex
+3
LevelMaster S/R: Pinpoint key support & resistance zones with precision. Perfect for traders of all levels Trade smarter
Indikator
Prop
Crypto
+5
VIX Pro: Confirm Real Breakouts & Filter Market Noise with Volatility
Indikator
The Weekly Daily Levels indicator shows the OHLC, and mid-point prices for the previous day and week.
Indikator
Three ZigZag lines
Indikator
AI
Prop
+14
Professional Trading Indicator Transform Your Trading with Intelligent Signal Detection RenkoProfit
Indikator
Forex
Crypto
+4
Pro Heikin Ashi Visual Overlay – Clean Trend Visualization
Indikator
ATR
Key Levels
It combines the trend-filtering power of Renko charts with the volatility tracking of ATR Bands
Indikator
ADX
ATR
+2
GOLD SENTINEL v1.0 - A CANDLE-COLORING INDICATOR FOR GOLD.
Indikator
RSI
Breakout
+1
"Identify key market zones and visualize support/resistance from multiple timeframes on a single chart.
Indikator
ADX
ATR
+5
Configure, simulate, and analyze trading strategies with custom filters, multi-target exits, and detailed performance me
Indikator
ATR
Prop
+14
Optimize exits with Chandelier Exit! Visualize stop-loss points dynamically for improved trading precision and safety.
Indikator
AI
ATR
+10
FX Sniper: Multi-pair Forex analysis tool. Features trend logic, adaptive pivots, and momentum filtering for major pairs
Indikator
VWAP
Support & Resistance
Trading.FC$_vwap Algo shows VWAP trends, dynamic support/resistance and deviation bands to spot potential trade entries.
Indikator
Prop
Forex
+10
Heatmap Pro analiza la volatilidad, el volumen y la acción del precio para "pintar" tu gráfico con zonas de color.
Indikator
Shows daily and sessions highs / lows and session boxes, everything configurable
Indikator
RSI
Fibonacci
+1
Spot RSI divergences on your chart and get an entry, stop and six targets when your filters line up.
Indikator
Master RSI reversals with Parabolic SAR precision! Get real-time alerts for high-probability trend changes.
Indikator
ATR
BOS
+5
Opening ranges, dynamic trend channels, and multi-scale breakout/retest analysis for clear intraday chart decisions.

Harga

Sejak 14/10/2026