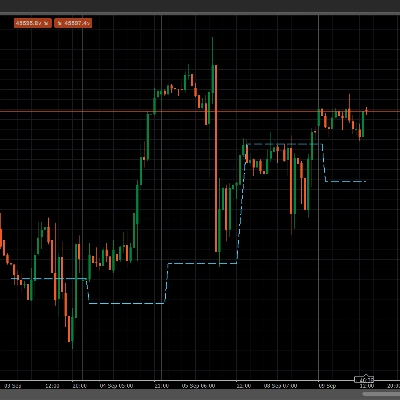
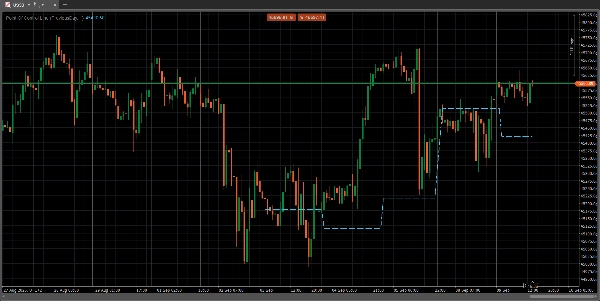
「POC Line lookback」ロゴ
POC Line lookback
「POC Line lookback」アップロード画像
登録日 21/04/2025

The Point of Control is a price level on a volume profile chart where the most trading volume has been conducted within a specified period. This level acts as a significant support or resistance zone because it represents a price where large trading institutions were most active and where market price found consensus. Traders use the line to identify key price zones, gauge market sentiment, and anticipate potential price movements and reversals

Indicator profile
0.0
レビュー: 0
カスタマーレビュー
この商品にはまだレビューがありません。お使いになったことがある方は、ぜひレビューをお願いします。
Forex
Indices
Products available through cTrader Store, including trading bots, indicators and plugins, are provided by third-party developers and made available for informational and technical access purposes only. cTrader Store is not a broker and does not provide investment advice, personal recommendations or any guarantee of future performance.

この作成者の他の商品

Displays the POC line for previous sessions in an easy to see manner.

これも好きかも

Regression Channel plots dynamic upper/lower bands around price to highlight trend direction, volatility, and potential
Order Block Detector is built to spot and display Order Blocks on chart, often triggering strong price reactions.
This is an indicator that can alert you about trendlines, horizontal lines and vertical lines.
Free Smart Money Concepts from TradingView for cTrader: BOS/CHoCH, OB, FVG, liquidity, MTF levels, discount zones.
Deep Mood Distribution (DMD) is a segmented volume-profile and sentiment tool that analyzes price action in fixed bar bl
Label each candle sequentially with flexible session resets.
The ultimate candlestick suite is here to help you detect most of the candlestick patters that exist today.
This indicator is designed to perform multiple non-linear regression analysis using four independent variables.
This indicator combines two independent analytical engines into a single overlay on your chart.
Designed to identify and visualize price reversal patterns using Bézier curves.
KAMA Keltner – Adaptive Volatility Channel for Precision Trading
Candle Timer & Strength DEMO for cTrader This is a DEMO version of the Candle Timer & Strength indicator. You can use al
Master volatility! ATR with visual alerts for precise trades and professional stops. Profit with clarity.
some user add moving average to macd to see better. in ctrader 4.3.11 there is a problem with this . I make a macd tha
Outside Candle Detector: Highlights major candles/zones with ATR filter & pattern labels. By Avydel Talbo, prop trader.
Follow The Trend cBot - INDICATOR - displays two Moving Average Bands for cBot or for your own use
Detects breakouts 📈 auto-draws levels 🚀 confirms trends 🐻 dynamic signals 🎨 customizable for any asset & timeframe.
🇫🇷 Visualisez vos sessions de marché et OPR d'un coup d’œil 🇬🇧 Visualize your market sessions & OPR at a glance !
登録日 21/04/2025