Descrizione
Bounty Killa – l'indicatore che individua le cacce alla liquidità degli stop-loss prima dei grandi operatori.
Bounty Killa è un indicatore cTrader progettato per i trader che amano operare con stop hunt / cattura di liquidità: quelle candele che superano i massimi o i minimi, eliminano gli stop e poi si invertano nella direzione opposta.
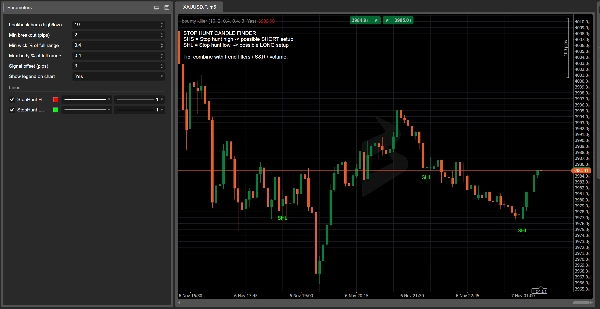
L'indicatore scansiona automaticamente ogni candela e segnala:
- SHS (Stop Hunt High) – probabile caccia agli stop sopra i massimi recenti → area in cui cercare setup short
- SHL (Stop Hunt Low) – probabile caccia agli stop sotto i minimi recenti → area in cui cercare setup long
La logica di rilevamento si basa su:
- superamento dei massimi/minimi recenti di almeno X pips,
- una lunga ombra che si estende oltre quel livello,
- un corpo piccolo e una chiusura nella direzione opposta alla rottura.
Niente più supposizioni “forse era una caccia agli stop”: Bounty Killer evidenzia direttamente sul tuo grafico le candele chiave, con etichette chiare, colori e una legenda sul grafico.
Perché piace ai trader:
- Mostra dove il mercato potrebbe aver catturato liquidità e dove un'inversione diventa più significativa.
- Completamente personalizzabile: finestra di lookback, breakout minimo in pips, percentuali corpo/ombra, offset del segnale.
- Si combina perfettamente con i classici supporti/resistenze, supply & demand, volume, blocchi d'ordine e concetti SMC.
- Ottimo per i trader che seguono setup basati sulla liquidità ma vogliono qualcosa di oggettivo e basato su regole invece del semplice giudizio visivo.
⚠️ Bounty Killa non è un sistema di trading completo e non apre né chiude operazioni.
Le candele segnate sono zone ad alta informazione che devono essere integrate con la tua strategia, analisi del trend e gestione del rischio.
Bounty Killa – Guida rapida per l'utente (EN)
1. Mercati e timeframe consigliati
- Timeframe: H1, H4, D1
(Timeframe inferiori come M1–M5 = molto rumore, da usare principalmente per studio.) - Simboli: indici, FX, crypto, azioni, commodities – ovunque si possa applicare un indicatore cTrader.
2. Come leggere i segnali
- SHS – Stop Hunt High (etichetta rossa sopra la candela)
-
- Il prezzo fa un picco sopra i massimi recenti, crea una lunga ombra superiore, e chiude ribassista.
- Idea: potenziale setup short dopo un falso breakout e cattura di liquidità sopra i massimi.
- SHL – Stop Hunt Low (etichetta verde sotto la candela)
-
- Il prezzo fa un picco sotto i minimi recenti, crea una lunga ombra inferiore, e chiude rialzista.
- Idea: potenziale setup long dopo un falso breakdown e cattura di liquidità sotto i minimi.
Bounty Killer non dice “compra/vendi ora”.
Evidenzia zone di liquidità dove un'inversione ha più senso.
3. Impostazioni base suggerite
Nei parametri dell'indicatore:
- Barre di lookback (high/low):
10–20
→ quante barre guardare indietro per i massimi/minimi recenti. - Breakout minimo (pips):
5–15pips
→ distanza minima oltre il massimo/minimo per considerare una caccia agli stop. - Percentuale minima di ombra rispetto al range totale:
0.60–0.70
→ almeno il 60–70% della candela deve essere ombra nella direzione della caccia agli stop. - Percentuale massima del corpo rispetto al range totale:
0.25–0.35
→ corpo piccolo rispetto al range totale della candela. - Offset del segnale (pips):
3–5
→ solo visivo, sposta leggermente l'etichetta SHS/SHL dalla candela.
4. Esempio semplice di strategia
Filtro di trend (EMA 200):
- Aggiungi una EMA 200 al tuo grafico.
- Solo short:
-
- Prezzo sotto EMA 200
- Ricevi un segnale SHS (stop hunt high).
- Solo long:
-
- Prezzo sopra EMA 200
- Ricevi un segnale SHL (stop hunt low).
Idea di ingresso:
- Aspetta che la candela di stop hunt chiuda.
- Entra sulla candela successiva solo se il prezzo conferma:
-
- Per SHS: la candela successiva rompe il minimo della candela SHS → considera uno short.
- Per SHL: la candela successiva rompe il massimo della candela SHL → considera un long.
Stop loss:
- Per SHS (short) → SL appena sopra il massimo della candela SHS.
- Per SHL (long) → SL appena sotto il minimo della candela SHL.
Take profit:
- Punta ad almeno 1:1.5 o 1:2 R/R, oppure
- Usa i massimi/minimi swing vicini, supporti/resistenze o zone di domanda/offerta come obiettivi.
5. Note di sicurezza e checklist rapida
Prima di usare un segnale di Bounty Killer, chiediti:
- Trend?
Il segnale è allineato con il trend generale (EMA 200 / struttura di mercato)? - Livello?
La caccia agli stop avviene a un livello significativo (massimo/minimo precedente, S/R, massimo/minimo di sessione, ecc.)? - Contesto?
Ci sono notizie, apertura/chiusura di sessione, picchi di volatilità? - Rischio?
La dimensione dello stop è adeguata alla tua gestione del denaro (max % per trade)?
Se 3–4 di questi punti coincidono, l'SHS/SHL di Bounty Killa non è solo “una bella candela”, ma una zona di alto valore su cui costruire un'idea di trading.
Riepilogo
The detection criteria include a breakout beyond recent highs/lows by a configurable number of pips, a long wick extending beyond that level, a small candle body, and a close opposite to the breakout direction. Signals are displayed directly on the chart with clear labels and colors, supported by an on-chart legend.
Recommended for use on hourly to daily timeframes (H1, H4, D1) across various markets including forex, indices, cryptocurrencies, stocks, and commodities, Bounty Killa is fully customizable with parameters such as lookback period, minimum breakout size, wick and body proportions, and signal label offset.
The indicator highlights high-value liquidity zones to support trading decisions but does not execute trades. It is intended to be combined with other analysis tools like support/resistance, volume, order blocks, and trend filters (e.g., 200 EMA) for developing objective, rule-based liquidity-based trading setups.
Recensioni dei clienti
5 | 50 % | |
4 | 50 % | |
3 | 0 % | |
2 | 0 % | |
1 | 0 % |


