Opis
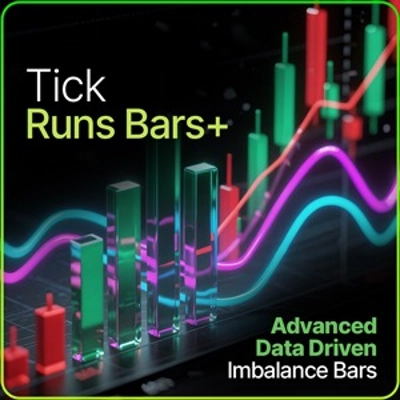
TRB — Wskaźnik Tick Runs Bars
Wykrywaj informacje rynkowe przed ruchami cen
Promocyjna cena wprowadzająca dla wczesnych użytkowników - zabezpiecz swoją kopię już teraz po obniżonej cenie, zanim cena wzrośnie do standardowej ceny detalicznej po zakończeniu okresu wstępnego.
Wersja 1.1
Użyj sekcji komentarzy, aby poprosić o więcej szczegółów
Dostępne sesje wideo z przewodnikiem po konfiguracji po zakupie
WSKAŹNIK TICK RUNS BARS (TRB)
Tick Runs Bars rozszerza analizę mikrostruktury rynku poprzez wykrywanie kierunkowej trwałości w przepływie transakcji. Opierając się również na książce Marcosa Lópeza de Prado Advances in Financial Machine Learning, ten wskaźnik identyfikuje momenty, gdy jednostronna presja rynkowa odbiega od oczekiwanych poziomów — ujawniając dzielenie zleceń instytucjonalnych i skoordynowaną aktywność handlową.
Główna idea
Traderzy instytucjonalni realizują duże zlecenia strategicznie — dzielą je na mniejsze części, ukrywają wolumen za zleceniami iceberg lub stosują algorytmiczne wykonanie, aby nie poruszać rynku. Taktyki te pozostawiają wyraźne ślady w postaci trwałych jednokierunkowych serii transakcji. Tick Runs Bars wykrywa te wzorce, mierząc, jak długo jedna strona dominuje w przepływie zleceń, ujawniając, kiedy dochodzi do celowego, agresywnego składania zleceń, a nie przypadkowych wahań cen.
Jak to działa
Wskaźnik oblicza długość wolumenów serii kupna i serii sprzedaży osobno — nie nettoje ich względem siebie jak tradycyjne metryki nierównowagi. Śledzi maksymalną jednostronną akumulację wolumenu (θT) względem dynamicznego oczekiwanego progu wyprowadzonego z historycznego prawdopodobieństwa kupna/sprzedaży i średnich wolumenów. Gdy rzeczywiste kierunkowe serie przekraczają oczekiwania, wyzwalany jest nowy słupek TRB. Ukazuje to „strukturalny kształt” wykonania przepływu zleceń — sygnaturę działania graczy instytucjonalnych.
Kluczowe cechy
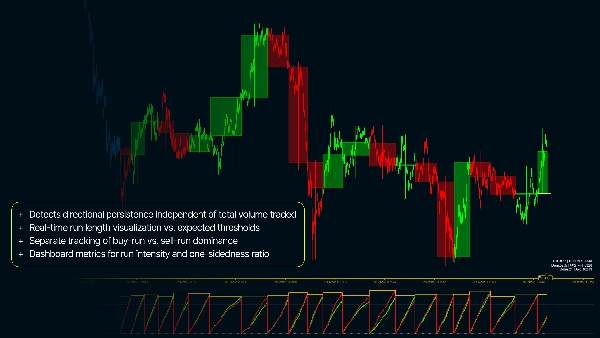
- Wykrywa kierunkową trwałość niezależnie od całkowitego wolumenu obrotu
- Wizualizacja długości serii w czasie rzeczywistym względem oczekiwanych progów
- Oddzielne śledzenie dominacji serii kupna vs. serii sprzedaży
- Kolorowanie świec na wykresie według przynależności do TRB pokazujące fazy wykonania zleceń
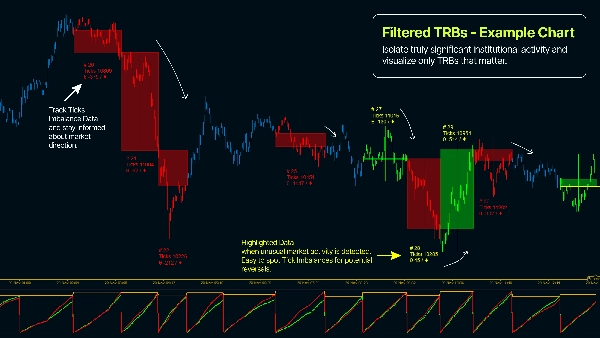
- Filtr minimalnego wolumenu do izolowania naprawdę istotnej aktywności instytucjonalnej
- Metryki na pulpicie do intensywności serii i wskaźnika jednostronności
- Konfigurowalne parametry oczekiwanego rozmiaru słupka i EWMA dostosowane do zmienności instrumentu
Dlaczego warto używać Tick Runs Bars?
- Identyfikuj realizację zleceń instytucjonalnych w czasie rzeczywistym — przed ich zakończeniem
- Wykrywaj ukrytą płynność i wzorce zleceń iceberg poprzez analizę przepływu
- Rozróżniaj skoordynowany handel od przypadkowego szumu rynkowego
- Rejestruj ruch cen wynikający ze strukturalnych nierównowag zleceń, a nie tylko statystycznych anomalii
- Czasuj wejścia/wyjścia podczas okresów znanej aktywności instytucjonalnej
- Stosuj zaawansowaną teorię mikrostruktury rynku, aby zyskać przewagę na szybszych interwałach czasowych
- Redukuj fałszywe sygnały pochodzące z drobnych skoków handlu detalicznego


