説明
ハーストサイクルチャネルオシレーターアドバンスド — インジケーターの説明
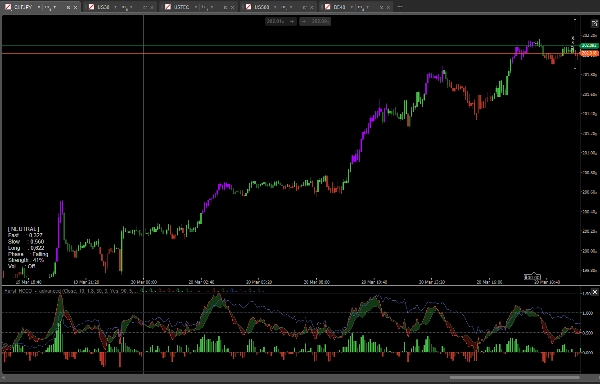
ハーストサイクルチャネルオシレーターアドバンスドは、ハーストサイクル理論の原則に基づいたcTrader用のプロフェッショナルなマルチサイクルモメンタムインジケーターです。生の価格モメンタムを測定する代わりに、現在の価格を動的に計算されたサイクルチャネル内に位置付け、トレーダーに価格が自然な周期的動きの中でどこにあるかを正規化された視点で提供します。
三つのサイクルレイヤー
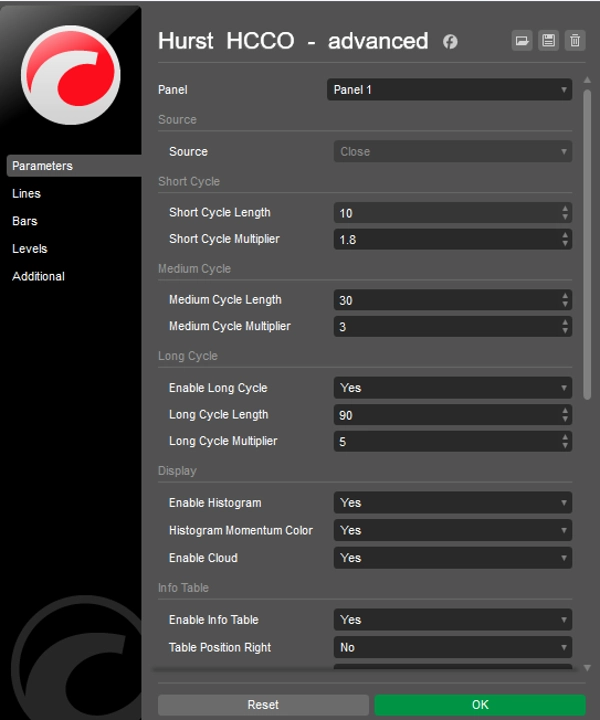
このインジケーターは、短期、中期、長期の三つの独立したサイクルチャネルを計算します。各チャネルはATRベースのエンベロープ内に中心を置いた指数移動平均から構築されます。短期と中期のサイクルがメインのオシレーターを駆動し、オプションの長期サイクルはより広範な市場コンテキストを提供します。すべてのサイクル長とATR乗数は完全に設定可能です。
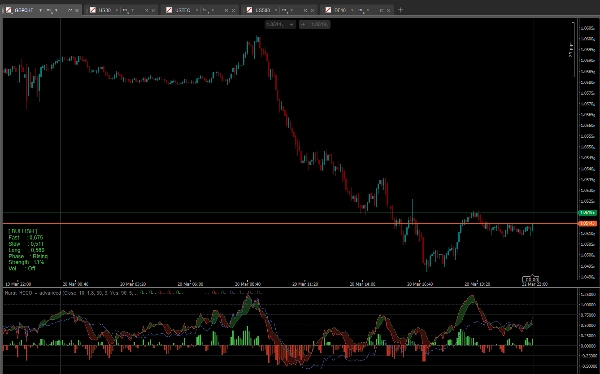
高速および低速オシレーターライン
高速ラインは現在の価格が中期サイクルチャネル内のどこに位置しているかを示します。0.5を超える値は価格がサイクルの上半分にあることを意味し、0.5未満は下半分を意味します。低速ラインは短期サイクルチャネルの中点を中期サイクルに対して表し、より滑らかな参照として機能します。これら二つのラインはMACDに似た構造の二重ラインオシレーターを形成しますが、サイクルジオメトリに基づいています。
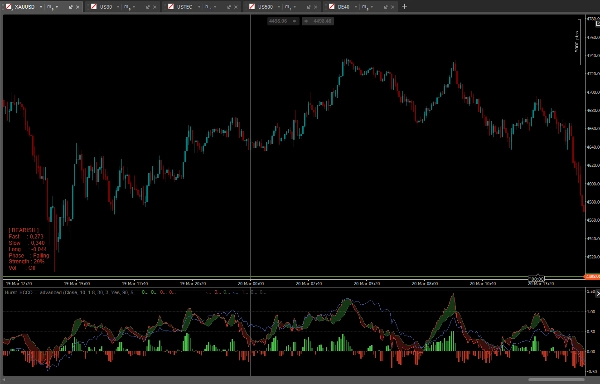
サイクルクラウド
オプションのクラウドは高速ラインと低速ラインの間の領域を塗りつぶします。高速が低速を上回ると緑色のクラウドが形成され(強気サイクルバイアス)、高速が低速を下回ると赤色のクラウドが形成されます(弱気サイクルバイアス)。このクラウドにより、二つのサイクルレイヤー間の関係が即座に読み取れます。
モメンタムヒストグラム
ヒストグラムは高速ラインと低速ラインの差を四色のモメンタムコードでプロットします — 強気加速、強気減速、弱気加速、弱気減速。これにより、方向だけでなくサイクルの動きがエネルギーを増しているか失っているかも簡単に把握できます。
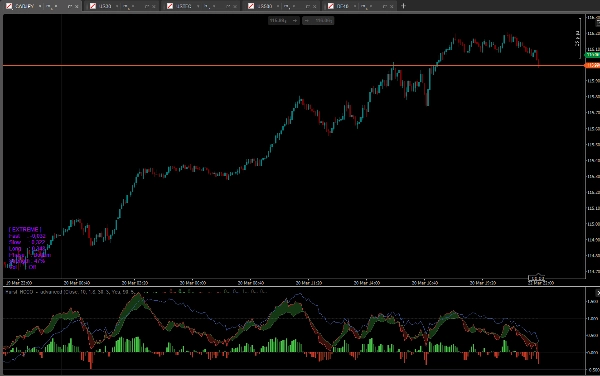
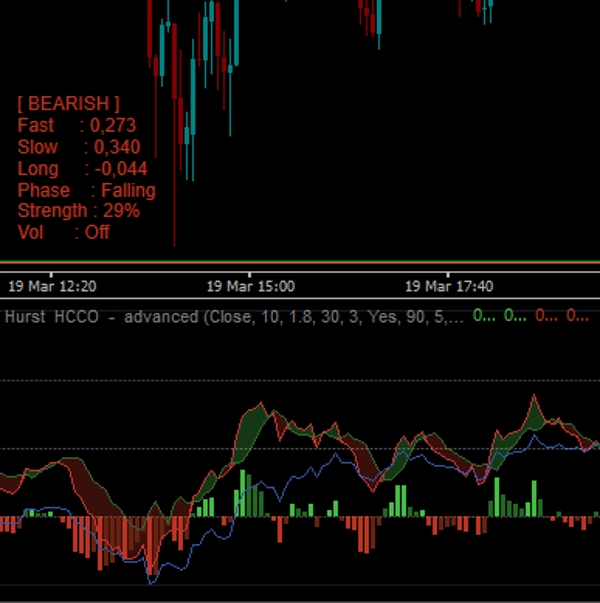
サイクルフェーズ検出
情報テーブルはサイクルの現在のフェーズを表示します:ボトム、プレボトム、回復、上昇、弱化、ポストピーク、ピーク。このラベリングは高速オシレーターの値とその方向から直接導出され、トレーダーに市場がサイクルのどこにあるかをわかりやすく示します。
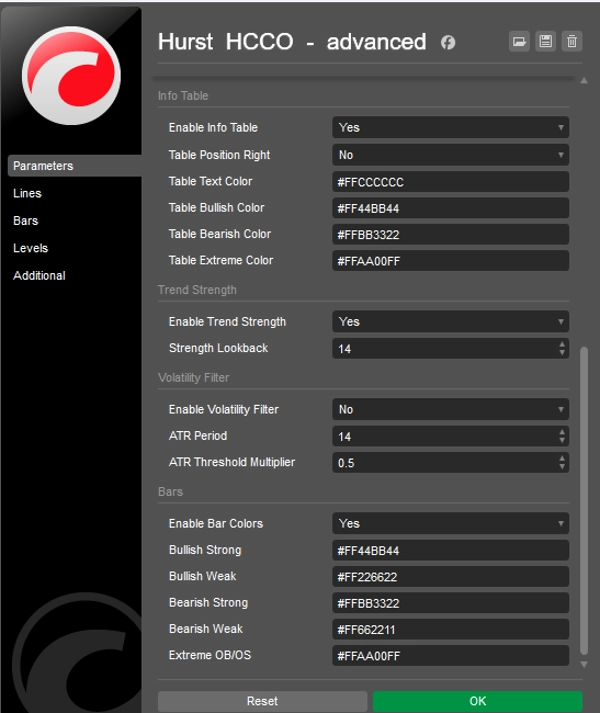
トレンド強度
設定可能なルックバックにより、高速ラインが0.5の中点からどれだけ離れているかに基づいて正規化されたトレンド強度スコアを計算します。結果は情報テーブルにパーセンテージで表示されます。
ボラティリティフィルター
オプションのATRベースのボラティリティフィルターは、市場のボラティリティが設定可能な閾値を下回るとヒストグラムバーとバーの色をグレーアウトし、フラットまたは乱高下する状況でオシレーターが誤ったシグナルを生成するのを防ぎます。
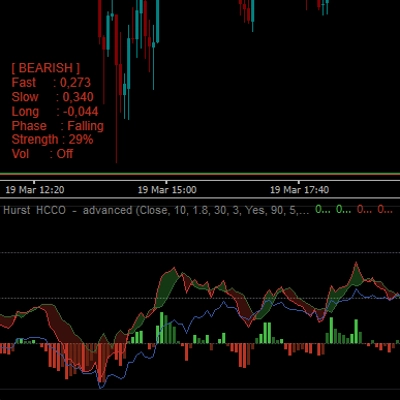
情報テーブル
コンパクトなチャート上のテーブルは現在の市場状態(強気、弱気、中立、極端)、高速、低速、長期オシレーターの値、サイクルフェーズ、トレンド強度のパーセンテージ、ボラティリティフィルターの状態を表示します。位置とすべての色は設定可能です。
バーの色付け
有効にすると、チャートのローソク足はオシレーターの状態に基づいて色分けされます — 強い強気、弱い強気、弱い弱気、強い弱気、極端な買われ過ぎ/売られ過ぎ。極端な読み値は高速ラインが0.0–1.0の範囲外に動くと発生し、サイクルチャネルを超えた価格のブレイクアウトを示します。
主な特徴の概要
- ハーストサイクル理論に基づく三つの設定可能なサイクルレイヤー
- サイクルチャネル位置に正規化された高速/低速の二重オシレーター
- 高速ラインと低速ライン間のサイクルクラウド
- 四色のモメンタムヒストグラム
- わかりやすいラベル付きの自動サイクルフェーズ検出
- リアルタイムのトレンド強度パーセンテージ
- ATRベースのボラティリティフィルター
- 完全な市場状態の内訳を表示するチャート上の情報テーブル
- オプションのローソク足の色付け
- アルファチャンネル対応の完全カスタマイズ可能なすべての色
- リペイントなし
概要
カスタマーレビュー
5 | 100 % | |
4 | 0 % | |
3 | 0 % | |
2 | 0 % | |
1 | 0 % |


