설명
📊 VPOC 몬테카를로 기대값
https://chartshots.spotware.com/c/69c558e2c68df
통합 시장 분석: 볼륨 프로필 + 통계적 예측 🎯
🎯 이것은 무엇인가요?
VPOC 몬테카를로 기대값은 두 가지 전문 거래 방법론을 결합한 정량적 분석 지표입니다:
- 시장 깊이 프로필 (VPOC) - 실제로 볼륨이 집중된 위치를 식별합니다 🏦
- 몬테카를로 시뮬레이션 - 통계적 확률에 기반한 미래 시나리오 예측 📈
결과는 돈이 어디에 있는지(통제점)와 어디로 갈 가능성이 있는지(예상 기대값)를 알려주는 분석 시스템입니다 🧠
⚙️ 어떻게 작동하나요?
모듈 1: 깊이 프로필 (VPOC) 📊
지표는 마지막 200개 바(설정 가능)를 분석하고 30개의 가격 수준에 볼륨을 분배합니다. 다음을 계산합니다:
- 통제점 (PoC): 가장 거래량이 많은 가격 - 매수자와 매도자가 가장 활발했던 시장 합의점 ⚖️
- 델타: 각 수준에서 매수 압력과 매도 압력의 차이 🔄
- 히트맵: 활동 집중도 시각화 🔥
논리: 가격은 대부분의 대기 유동성이 존재하는 PoC 쪽으로 되돌아가는 경향이 있습니다. 가격이 PoC에서 멀리 떨어져 있으면 되돌아올 확률이 높습니다 🔄
모듈 2: 통계적 예측 (몬테카를로) 🎲
확률적 시뮬레이션(기본 1,000회 반복)을 사용하여 미래 가격을 예측합니다:
- 자산의 과거 추세와 연간 변동성을 계산합니다 📉📈
- 정규 분포(기하학적 브라운 운동 모델)를 사용해 무작위 경로를 생성합니다 🌊
- 표준 편차 밴드(±1 시그마)를 사용해 기대값을 추정합니다 📏
적용 공식: - 바당 드리프트 = 연간 수익률 / 거래일 수 🧮
- 바당 변동성 = 연간 변동성 / √일 수 ⚡
- 예측 = 현재 가격 × e^(총 드리프트 + 정규 무작위 × 총 변동성) 🔢
모듈 3: 시너지 🔗
두 분석을 결합하여 상황별 신호를 생성합니다:
표
신호 조건 의미
강세 ↑ 🟢 가격 > PoC + 긍정적 예측 볼륨으로 확인된 강세 추세
약세 ↓ 🔴 가격 < PoC + 부정적 예측 볼륨으로 확인된 약세 추세
기회 ★ 💡 가격 < PoC + 긍정적 예측 볼륨 지지에서의 반등 가능성
발산 ⚠️ ⚠️ 가격 > PoC + 부정적 예측 반전 가능성 경고
📈 용도는 무엇인가요?
✅ 주요 볼륨 수준 식별 - PoC는 가격 자석 역할을 합니다 🧲
✅ 성공 확률 추정 - 시뮬레이션 내 승리 시나리오 비율 🏆
✅ 위험/보상 평가 - 예상 샤프 비율 및 표준 편차 📊
✅ 거래 방향 확인 - PoC 대비 포지션과 통계적 모멘텀 간 시너지 🎯
✅ 목표 예측 - 정의된 보유 기간 동안의 예상 가격 수준 🎯
🎮 설정 및 사용법
주요 매개변수:
표
그룹 매개변수 기본값 설명
깊이 프로필 분석 기간 200 바 볼륨 프로필 계산을 위한 이력
가격 수준 30 프로필 해상도 (수준이 많을수록 세부 정보 증가) 🔍
수평 오프셋 5 차트상의 프로필 위치 📏
통계적 예측 최대 작동 기간 252 바 예측의 시간 범위 ⏱️
투자 자본 $1,000 금전 계산의 기준 💰
시뮬레이션 1,000 무작위 경로 수 (많을수록 정확하지만 느림) 🔄
무위험 이자율 5% 샤프 비율 계산용 📉
과거 전략 TP/SL 사용 안 함 고정 목표로 시뮬레이션 활성화 🎯
결과 해석 방법 표:
plain
복사
기대값 통계
┌──────────────┬─────────┬─────────┬─────────┬────────┐
│ 방법 │ $ 금액│ % 수익│ 승률│ 샤프 │
├──────────────┼─────────┼─────────┼─────────┼────────┤
│ 과거 │ -$19.56 │ -1.96% │ 47.2% │ -1.24 │
│ 시뮬레이션 │ -$54.05 │ -5.40% │ 21.4% │ -4.95 │
└──────────────┴─────────┴─────────┴─────────┴────────┘
- 과거: 유사한 과거 거래의 평균 성과 📜
- 시뮬레이션: 1,000회 몬테카를로 시뮬레이션의 평균 결과 🎲
- 승률: 긍정적 결과 시나리오의 비율 ✅
- 샤프: 위험 조정 수익률 (1 이상은 좋음, 음수는 나쁨) 📈
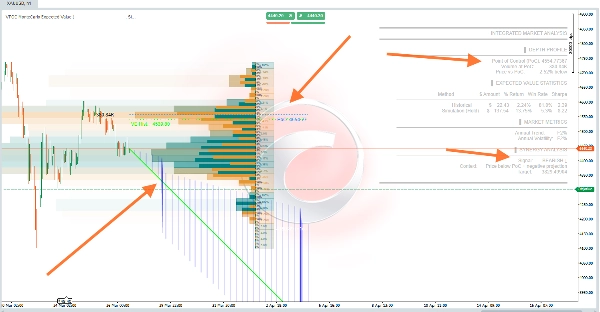
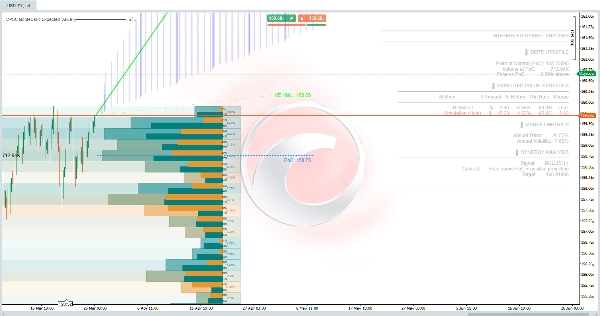
🖼️ 차트의 시각적 요소
표
요소 색상 의미
볼륨 프로필 주황/파랑 그라데이션 가격 수준별 활동 집중도 🎨
PoC 선 파란 점선 미래로 투영된 통제점 🔵
EV 예측선 녹색/마젠타 예상 가격 경로 🟢🔴
±1σ 밴드 흰색 점선 68% 신뢰 구간 📊
과거 EV 선 녹색 점선 과거 데이터를 기반으로 한 기대값 🟢
예측 구역 반투명 파란색 채움 밴드 사이의 확률 영역 🔵
⚠️ 중요 - 한계점
- 매수/매도 신호 아님 - 확률적 분석 도구입니다 🛠️
- 몬테카를로 시뮬레이션은 과거 분포가 유지된다고 가정 (블랙스완 이벤트 예측 불가) 🦢❌
- PoC는 동적임 - 새로운 바마다 재계산 🔄
- 충분한 이력 필요 - 신뢰할 수 있는 예측을 위해 최소 252 바 📊
- 암호화폐 - 전통 시장 252일 대비 365일 연간 거래일에 자동 조정 🪙
💡 권장 사용 전략
- 기회 ★ 💡 찾기 - 가격이 PoC 아래이지만 긍정적 예측 (저평가 가능성)
- 승률 > 50%로 확인 - 성공 확률이 더 높음 ✅
- 발산 ⚠️ ⚠️ 피하기 - 실제 볼륨 대비 과대평가된 가격
- PoC를 기준으로 사용 - 이 유동성 수준 주변에 스톱 또는 목표 설정 🎯
- 과거와 시뮬레이션 비교 - 크게 다르면 시장 체제가 변하는 중 🔄
요약
Using Monte Carlo simulations with default 1,000 iterations, it projects future price scenarios based on historical trends and volatility, applying a geometric Brownian motion model. This generates expected price trajectories with confidence bands (±1 standard deviation), estimating probabilities of success, risk-adjusted returns (Sharpe ratio), and potential target levels.
The combined analysis produces contextual signals such as Bullish, Bearish, Opportunity, and Divergence, based on price relation to PoC and projection direction. It supports various markets including Forex, stocks, commodities, indices, and cryptocurrencies, adjusting parameters like trading days accordingly.
Key configurable settings include analysis period, profile resolution, simulation count, and risk-free rate. Visual elements on the chart display volume profiles, PoC lines, expected value projections, and confidence intervals. The tool is designed for probabilistic market assessment and trade confirmation rather than direct buy/sell signals.