Descrição
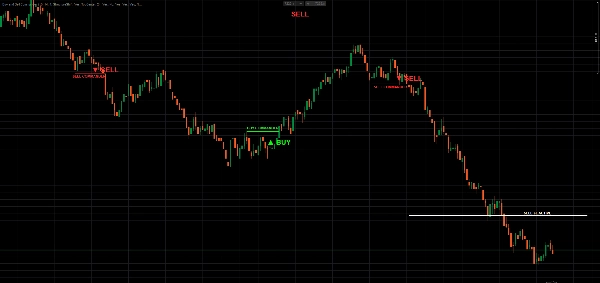
BUY & SELL Commander is designed to help traders quickly understand the current market direction without overcomplicating the chart.
The indicator displays a simple dashboard at the top of the chart showing the active market status:
BUY
SELL
or
NEUTRAL
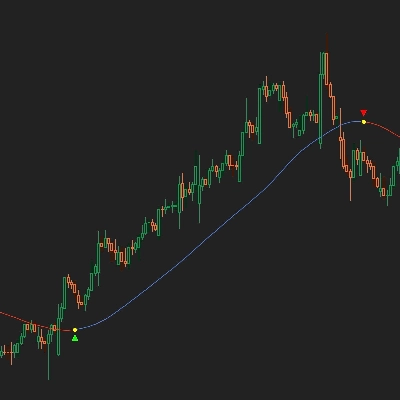
It also plots clear BUY and SELL signals directly on the chart and uses a white Active SL Line as a dynamic trend-flip level.
The goal of this indicator is simple:
to help traders see when buyers or sellers are currently in control.
How It Works
The indicator uses market structure and an ATR-based active stop line to determine the current trading direction.
In simple terms:
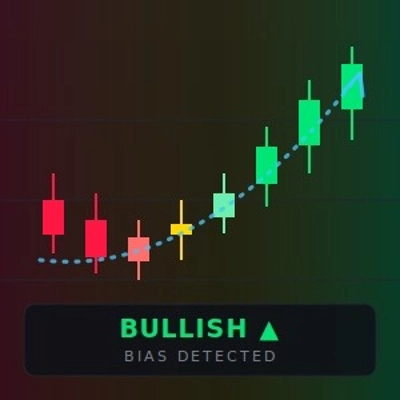
- When the market is bullish, the dashboard shows BUY.
- When the market is bearish, the dashboard shows SELL.
- Before a valid signal appears, the dashboard shows NEUTRAL.
The white Active SL Line is the key part of the indicator.
When BUY is active, the white line normally follows below price.
When SELL is active, the white line normally follows above price.
Close Cross Active SL Mode
In CloseCrossActiveSL mode, the logic is very easy to understand.
When the indicator is in SELL mode, price must close above the white SELL SL ACTIVE line to trigger a new BUY signal.
When the indicator is in BUY mode, price must close below the white BUY SL ACTIVE line to trigger a new SELL signal.
So the basic logic is:
SELL active + candle closes above the Active SL Line = BUY signal
BUY active + candle closes below the Active SL Line = SELL signal
The indicator uses candle close confirmation, not only wick movement. This helps reduce false flips caused by temporary spikes.
What the Indicator Shows
Dashboard
A simple dashboard displays the current status:
- BUY
- SELL
- NEUTRAL
This makes it easy to see the current direction at a glance.
BUY and SELL Signals
The indicator marks direction changes on the chart with clear signals:
- ▲ BUY
- ▼ SELL
Active SL Line
The white Active SL Line works as a dynamic trend-following stop line.
In BUY mode, the line follows below price.
In SELL mode, the line follows above price.
When price closes through this line, the market direction can change.
Main Features
- Simple BUY / SELL / NEUTRAL dashboard
- Clear BUY and SELL chart signals
- ATR-based Active SL Line
- Candle close confirmation
- Market structure based signal detection
- Optional CloseCrossActiveSL mode
- Adjustable ATR settings
- Adjustable dashboard position
- Clean overlay display
- Suitable for multiple timeframes and symbols
Recommended Use
BUY & SELL Commander can be used as:
- a trend direction filter
- a visual trailing stop guide
- a trade confirmation tool
- a market bias dashboard
- a simple BUY / SELL decision support indicator
Example usage:
If the dashboard shows BUY, traders may focus mainly on buy opportunities.
If the dashboard shows SELL, traders may focus mainly on sell opportunities.
If the dashboard shows NEUTRAL, traders may wait for a valid signal.
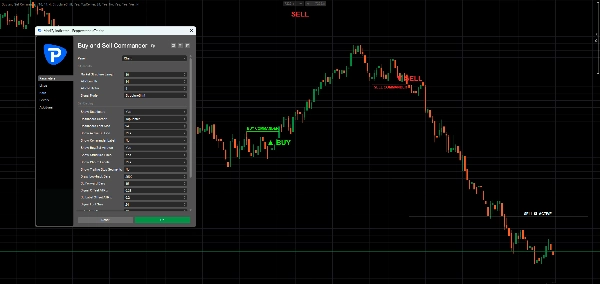
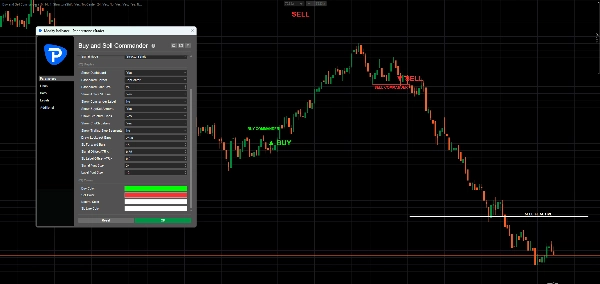
Main Settings
Market Structure Length
Controls how sensitive the indicator is to market swings.
Lower values create faster signals.
Higher values create smoother and slower signals.
ATR Length
Controls the ATR calculation period.
ATR Multiplier
Controls the distance of the Active SL Line from price.
Lower values make the line tighter and more sensitive.
Higher values make the line wider and smoother.
Signal Mode
Choose between:
StructureShift
Uses market structure breaks to detect direction changes.
CloseCrossActiveSL
Uses candle close crosses of the Active SL Line to detect direction changes.
Dashboard Position
Choose where the BUY / SELL / NEUTRAL dashboard appears on the chart.
Simple Trading Logic
The indicator is built around one simple idea:
Trade with the active direction until price closes through the Active SL Line.
When BUY is active, the market bias remains bullish until price closes below the Active SL Line.
When SELL is active, the market bias remains bearish until price closes above the Active SL Line.
Important Note
This indicator does not guarantee profitable trades and should not be used as a standalone trading system. It is designed as a visual decision-support tool. Always combine it with your own strategy, risk management, and market analysis.
Disclaimer
Trading forex, indices, commodities, and other financial markets involves risk. Past performance does not guarantee future results. Use this indicator for analysis and educational purposes only.