

Descrizione
- MiniBull MTF Observer
- Un indicatore. Ogni timeframe. Zero cambio di grafico.
- BREVE DESCRIZIONE
- Visualizza 11 timeframe, un punteggio segnale composito, un calcolatore di trade integrato e analisi dei livelli chiave di prezzo - tutto da un unico cruscotto attivabile sul tuo grafico.
- DESCRIZIONE COMPLETA
- MiniBull MTF Observer è un cruscotto di analisi di mercato multi-timeframe creato per i trader che non vogliono saltare tra i grafici per avere una visione completa.
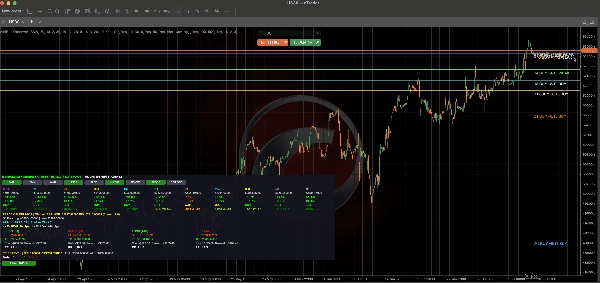
- Invece di sfogliare M1, M5, M15, M30, H1, H4, H8, H12, D1, W1 e MN1 uno per uno, MiniBull calcola e mostra tutti gli 11 timeframe contemporaneamente - posizione della media mobile, direzione del trend e un punteggio composito ponderato - in un unico cruscotto compatto e richiudibile.
- - Panoramica Multi-Timeframe
- Vedi istantaneamente se il prezzo è sopra o sotto la sua media mobile in ogni timeframe da M1 a Mensile, con distanza in pips e percentuale, e un chiaro segnale BUY / SELL / WAIT per ciascuno.
- - Punteggio Segnale Composito (0-13)
- Ogni timeframe riceve un punteggio ponderato che combina RSI, MACD, Stocastico, CCI, Momentum e molteplici incroci di MA (SMA5, SMA20, EMA21, EMA50) - così puoi valutare la forza del segnale a colpo d'occhio invece di leggere cinque indicatori separati.
- - Scelta della Media Mobile
- Passa tra SMA, EMA e KAMA (Media Mobile Adattiva di Kaufman) direttamente dai pulsanti del cruscotto - senza bisogno di riaprire le impostazioni.
- - Calcolatore di Trade Integrato
- Calcola automaticamente i livelli SL/TP e rischio/ricompensa per setup Long e Short usando due metodi affiancati:
- - Livelli High/Low D1 precedenti
- - Stop basati su ATR (ATR di Wilder, moltiplicatori configurabili)
- - Analisi dei Livelli di Prezzo
- Traccia quante volte il prezzo ha testato storicamente il livello attuale, quanto spesso è salito o sceso, e segnala condizioni di Massimo Storico / Minimo Storico / Prima Volta al Livello - dandoti contesto prima di entrare in un trade.
- - Avvisi Livello D1
- Ricevi notifiche (suono e/o email) quando il prezzo si avvicina o rompe il massimo/minimo del giorno precedente, e quando un timeframe passa in una zona di forte acquisto/vendita.
- - Cruscotto Pulito e Richiudibile
- Il cruscotto si trova silenziosamente nell'angolo in basso a sinistra e parte chiuso di default - clicca il pulsante di attivazione ogni volta che vuoi la panoramica completa. Le linee MA rimangono sempre tracciate sul grafico, indipendentemente dallo stato del cruscotto, così il tuo grafico non perde mai contesto.
- - Completamente Personalizzabile
- Regola i periodi di MA/RSI/MACD/Stocastico/CCI/Momentum, i moltiplicatori ATR, le gamme di avviso, i colori, la dimensione del font e la posizione del pannello per adattarli al tuo stile di trading.
- PERCHÉ I TRADER USANO MINIBULL
- - Smetti di cambiare tra finestre di grafico per controllare timeframe più alti/più bassi
- - Individua allineamenti (o conflitti) tra timeframe in pochi secondi
- - Ottieni suggerimenti oggettivi per SL/TP invece di indovinare
- - Sapere immediatamente se stai operando vicino a un livello storicamente significativo
- Funziona su qualsiasi simbolo e qualsiasi timeframe di grafico.
Riepilogo
Profilo indicatore
Categoria indicatore
Trend
Tipo di output
Visualizzazione
Requisiti per i dati
Solo barre
Segnali supportati
Forza del trend
Intervallo di apertura della sessione
Rottura
Livello rotto
Livello raggiunto
Volatilità
Inversione
Divergenza
Superamento
Recensioni dei clienti
0.0
Recensioni: 0
Recensioni dei clienti
Questo prodotto non ha ancora ricevuto recensioni. L'hai già provato? Fallo sapere agli altri per primo!
Discussioni
Domande frequenti
Inside Bar
EMA
SMA
Key Levels
ATR
Moving Average
Support & Resistance
I prodotti disponibili tramite cTrader Store, inclusi bot di trading, indicatori e plugin, sono forniti da sviluppatori terzi e resi disponibili esclusivamente a scopo informativo e di accesso tecnico. cTrader Store non è un broker e non fornisce consulenze in materia di investimento, raccomandazioni individualizzate o garanzie di risultati futuri.