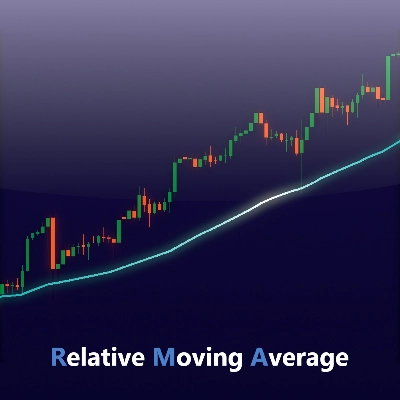
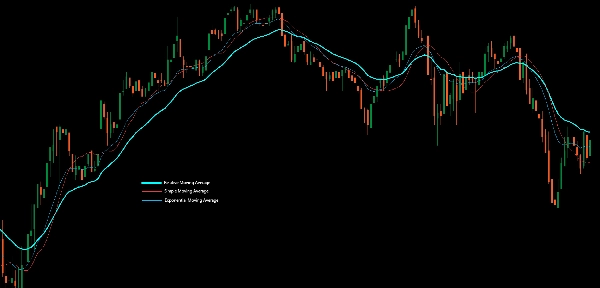
cTraderで利用可能になった相対移動平均(RMA)インジケーターのご紹介!
この相対移動平均(RMA)は、平滑移動平均(SMMA)とも呼ばれ、ラグを減らしつつ曲線の滑らかさを保つことを目的とした移動平均の一種です。これは、TradingViewの組み込み「RMA」関数で使用されているのと同じ計算式であり、相対力指数(RSI)などの人気インジケーターで広く使われています。
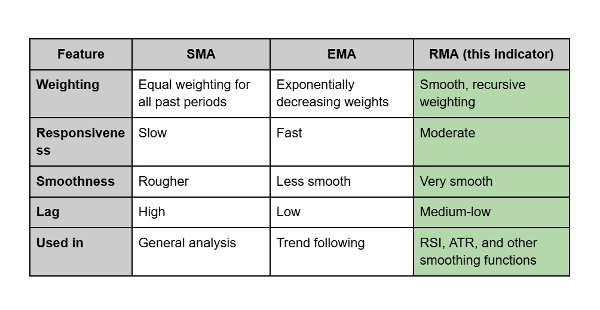
RMAは応答性と安定性のバランスを取るよう設計されています。これは指数移動平均(EMA)よりも滑らかに更新されますが、単純移動平均(SMA)よりも価格変動に迅速に反応します。
違いのポイント:
- SMAはすべての価格を均等に平均化するため、ラグやノイズが発生します。
- EMAは最近の価格により重みを置くため、非常に応答性が高いですが時にノイズが多くなります。
- 対照的にRMAは両者の利点を融合させており、価格変動のボラティリティを平滑化しつつ、価格変動へのタイムリーな反応を維持します。
実用例:
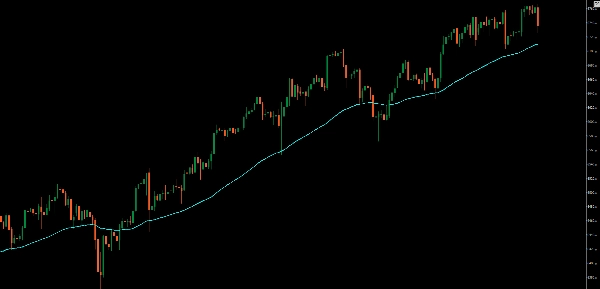
トレーダーはしばしばRMAをより滑らかなトレンドラインやモメンタム指標の一部として使用します。これは、重要なラグを導入せずにノイズをフィルタリングしたい場合に特に効果的で、長期トレンドの確認や買われすぎ・売られすぎの分析をサポートするのに理想的です。
インジケーターのプロフィール
0.0
レビュー: 0
カスタマーレビュー
この商品にはまだレビューがありません。お使いになったことがある方は、ぜひレビューをお願いします。
BTCUSD
Forex
Indices
EURUSD
Commodities
GBPUSD
NZDUSD
Prop
Crypto
Stocks
XAUUSD
NAS100
USDJPY
cTrader Storeで入手可能な取引ボット、インジケーター、プラグインなどの商品は、第三者の開発者が提供するものであり、情報と技術の取得のみを目的としてご利用いただけます。cTrader Storeはブローカーではなく、投資助言や個人的な推奨を行うことも、将来のパフォーマンスを保証することもありません。


登録日 25/09/2025
25
販売
314
無料インストール