
説明
オシレーター・スキャナーでリアルタイムに市場の勢いを追跡しましょう!
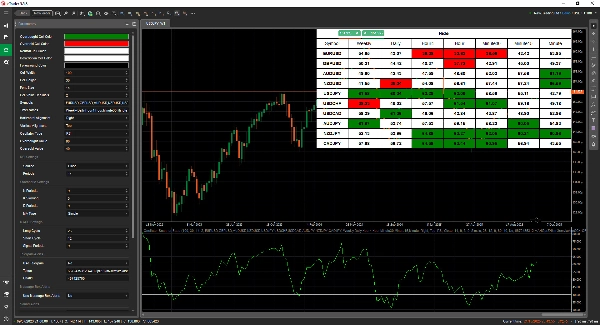
直感的で強力なダッシュボードを備えたOscillator Scannerは、複数の資産と時間枠にわたるモメンタムとオシレーターのシグナルに依存するトレーダーに最適なツールです。
完全にカスタマイズ可能な設定でオシレーターのデータをリアルタイムで監視・比較し、より迅速かつ情報に基づいた取引判断を可能にします。
利用可能なオシレーター:
- RSI
- Stochastic D
- Stochastic K
- MACD
- MACD Signal
- Accelerator Oscillator
- Awesome Oscillator
- Bears Power
- BullsPower
- ChandeMomentumOscillator
- CommodityChannelIndex
- CyberCycle
- DeMarker
概要
インジケーターのプロフィール
カスタマーレビュー
0.0
レビュー: 0
カスタマーレビュー
この商品にはまだレビューがありません。お使いになったことがある方は、ぜひレビューをお願いします。
ディスカッション
よくあるご質問
Forex
EURUSD
GBPUSD
NZDUSD
RSI
Crypto
cTrader Storeで入手可能な取引ボット、インジケーター、プラグインなどの商品は、第三者の開発者が提供するものであり、情報と技術の取得のみを目的としてご利用いただけます。cTrader Storeはブローカーではなく、投資助言や個人的な推奨を行うことも、将来のパフォーマンスを保証することもありません。
この作成者の他の商品


価格
10
販売
345
無料インストール