
説明
cTrader用プロフェッショナルフットプリント&デルタインジケーター
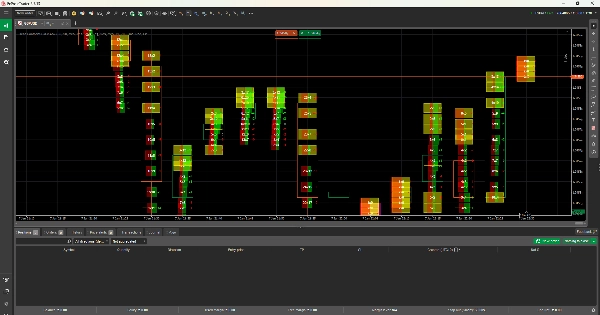
このcTrader用フットプリントインジケーターはリアルなティックデータを読み取り、買い手と売り手が各価格レベルでどのように相互作用しているかを表示します。これにより、出来高、ビッド/アスクのデルタ、不均衡を表示し、トレーダーが市場を支配しているのが誰かを明確に把握できるようにします。
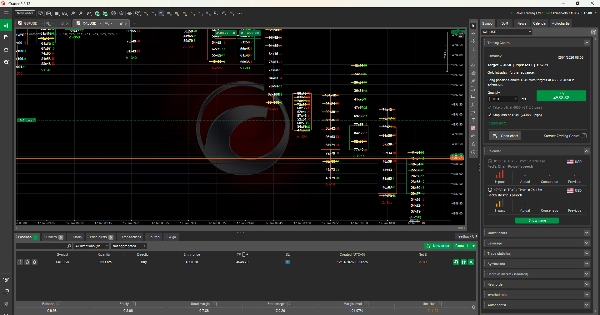
マーケットプロファイルとボリュームプロファイルの概念を使用して構築されており、インジケーターは高い活動エリア、価値ゾーン、強力なサポートまたはレジスタンスを強調表示します。価格だけで推測するのではなく、トレーダーは実際の取引量と注文フローに基づいて意思決定を行うことができます。
スキャルピングや日中取引に最適なこのツールは、価格変動の背後にある真実のストーリーを明らかにすることで、cTraderユーザーにプロフェッショナルな優位性を提供します。
このインジケーターは、各ローソク足の内部で実際に何が起こっているかを理解するのに役立ちます。ティックデータを読み取り、各価格で何人の買い手と売り手が取引したかを表示します。
次のことがはっきりと見えます:
- 買い手が強い場所
- 売り手が強い場所
- モメンタムが増加または減速している時
インジケーターはまた、デルタ、つまり買い圧力と売り圧力の差を表示します。これはマーケットプロファイルとボリュームプロファイルを使用して構築されているため、市場が反応する重要な価格エリアを簡単に見つけることができます。
これにより、初心者でも推測する必要がなくなり、実際の出来高と実際の市場活動を確認できるため、価格に基づく単なるインジケーターよりも取引が容易になります。
概要
インジケーターのプロフィール
カスタマーレビュー
0.0
レビュー: 0
カスタマーレビュー
この商品にはまだレビューがありません。お使いになったことがある方は、ぜひレビューをお願いします。
ディスカッション
よくあるご質問
BTCUSD
Forex
Signal
Breakout
Indices
EURUSD
Commodities
GBPUSD
NZDUSD
Martingale
Scalping
Supertrend
Fair Value Gap
SMC
Crypto
Grid
Stocks
AI
XAUUSD
NAS100
USDJPY
cTrader Storeで入手可能な取引ボット、インジケーター、プラグインなどの商品は、第三者の開発者が提供するものであり、情報と技術の取得のみを目的としてご利用いただけます。cTrader Storeはブローカーではなく、投資助言や個人的な推奨を行うことも、将来のパフォーマンスを保証することもありません。
この作成者の他の商品


これも好きかも


価格
登録日 15/01/2025
7
販売