説明
ADXアドバンストクラウド&モメンタムシステム
標準の平均方向性指数(ADX)は強力なツールですが、正直なところ、3本の交差するライン(+DI、-DI、ADX)を見つめるのは混乱を招き、目に負担がかかります。
ADXアドバンストインジケーターはこのクラシックなツールを完全に現代化しました。混沌としたラインを、誰が支配しているのか(ブル対ベア)とトレンドの強さを一目で教えてくれる明確で視覚的なパワーハウスに変換します。
主な特徴
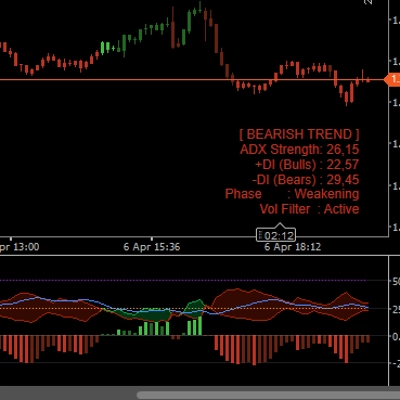
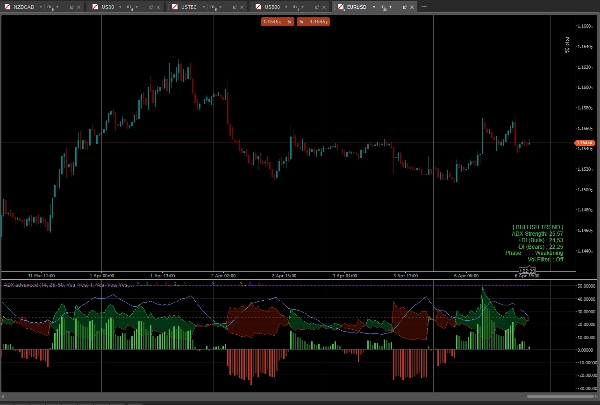
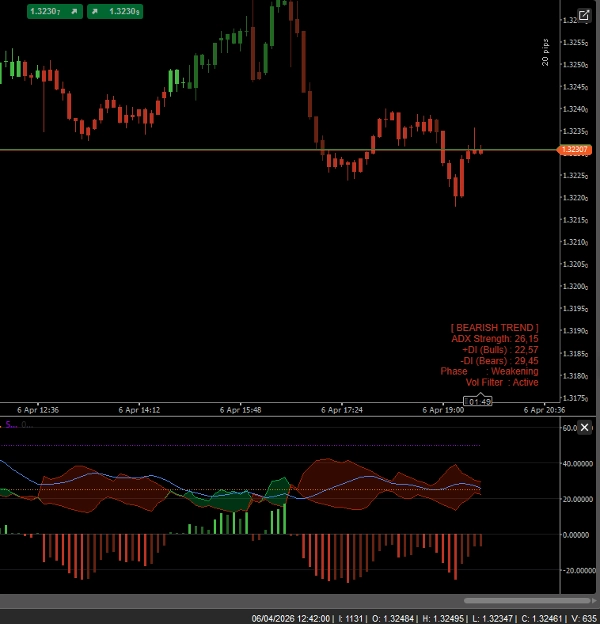
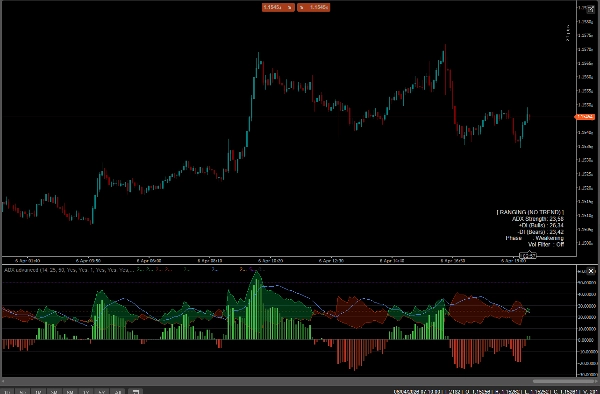
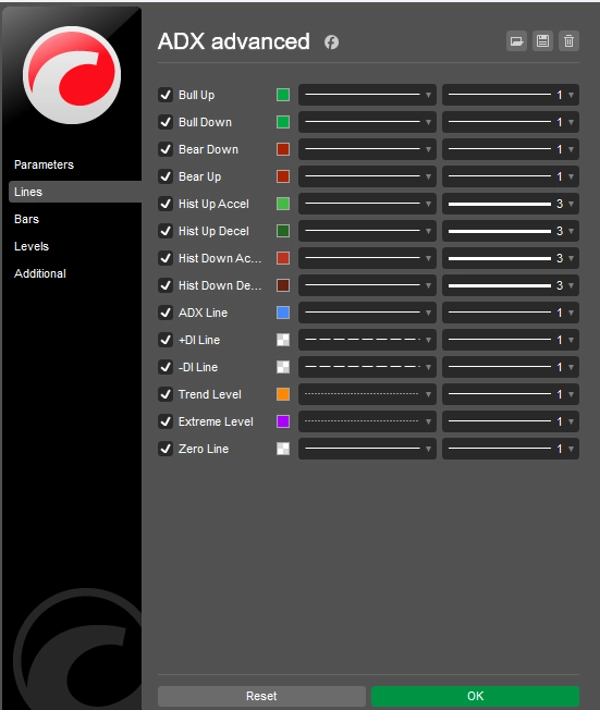
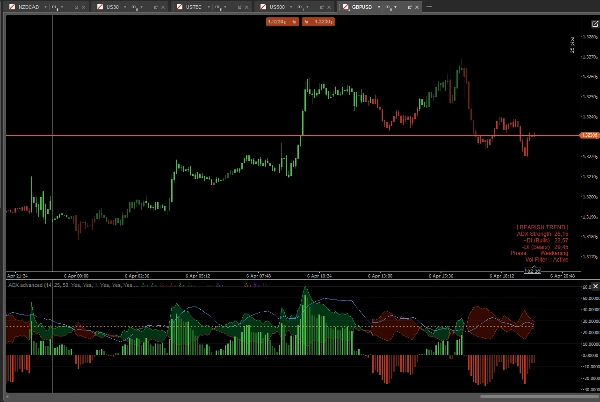
- 方向性クラウド(DIクラウド): ラインの交差の代わりに、+DIと-DIの間のスペースが動的なカラークラウドで満たされます。グリーンクラウド=ブルが支配。レッドクラウド=ベアが支配。
- モメンタムヒストグラム: インジケーターの下部にカスタム構築されたヒストグラムが+DIと-DIの正確な距離を測定します。加速/減速の色を特徴とし、トレンドが実際に反転する前にモメンタムの衰えを見つけることができます。
- スマートバー着色(ペイントバー): インジケーターはトレンドの強さに基づいて直接価格ローソク足を着色します!
-
- 明るい緑/赤:強いトレンド(ADX > 25かつ+DI/-DIの整列)
- 暗い緑/赤:弱いトレンド/レンジ(ADX < 25)
- 紫/マゼンタ:極端に過剰拡張したトレンド(ADX > 50)-プルバックに備えましょう!
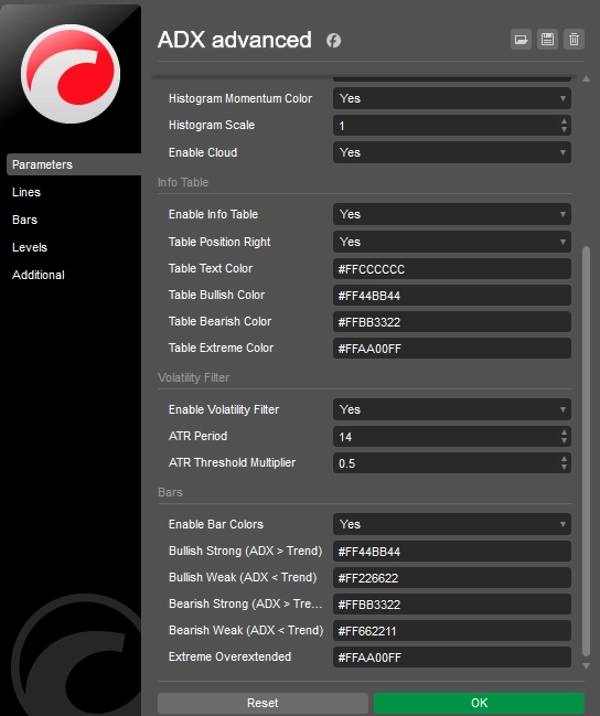
- チャート上情報パネル: スタイリッシュで邪魔にならないダッシュボードが現在のマーケット状態(トレンド、レンジ、極端)、ADXの強さ、モメンタムフェーズをリアルタイムで表示します。
- 内蔵ボラティリティフィルター(ATR): 市場が完全にフラットになるとローソク足とヒストグラムバーをグレーアウトするオプションのATRフィルターで、ノイズの多い取引を避けられます。
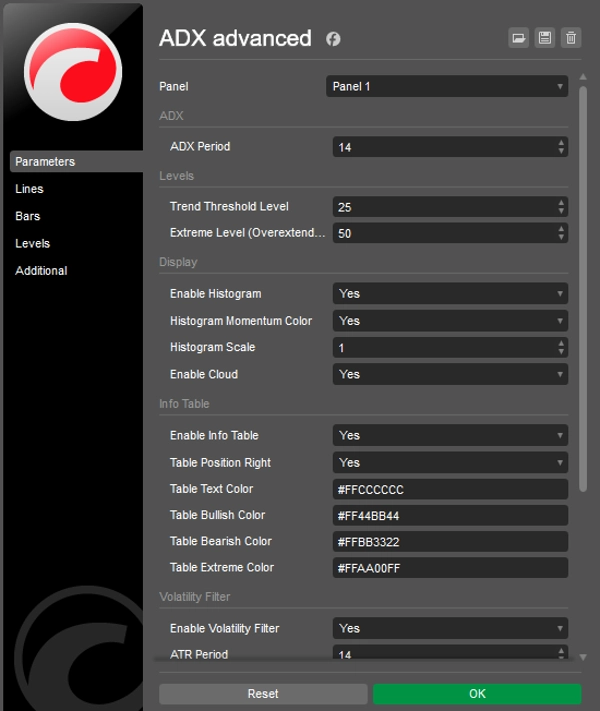
- 完全カスタマイズ可能: 色、閾値(トレンドレベル25、極端レベル50)、ヒストグラムのスケーリングを変更して、個人の取引スタイルやチャートテーマに合わせられます。
使い方は?
- ADXの青いラインが25の閾値を上回るのを待ちます(トレンドがアクティブ)。
- クラウドとヒストグラムを見て方向を確認します(ロングは緑、ショートは赤)。
- ブレイクアウトを取引し、ローソク足が「強い」色で塗られている間トレンドに乗ります。
- ADXラインが50の極端レベルを超えたら利益確定またはトレーリングストップを行います(ローソク足が紫に変わります)。
概要
インジケーターのプロフィール
カスタマーレビュー
4.3
レビュー: 3
5 | 33 % | |
4 | 67 % | |
3 | 0 % | |
2 | 0 % | |
1 | 0 % |
カスタマーレビュー
April 16, 2026
April 12, 2026
ディスカッション
よくあるご質問
BTCUSD
Forex
Signal
Indices
EURUSD
Commodities
GBPUSD
NZDUSD
Prop
XAUUSD
NAS100
ATR
USDJPY
cTrader Storeで入手可能な取引ボット、インジケーター、プラグインなどの商品は、第三者の開発者が提供するものであり、情報と技術の取得のみを目的としてご利用いただけます。cTrader Storeはブローカーではなく、投資助言や個人的な推奨を行うことも、将来のパフォーマンスを保証することもありません。


価格
24
販売
677
無料インストール