
ATR advanced
Indikator
Version 1.0, Apr 2026
Windows, Mac
4.3
Bewertungen: 3

32
Verkäufe
992
Kostenlose Installationen
Beschreibung
ATR Advanced Volatility & Trend System
Der Standard Average True Range (ATR) ist ein großartiges Werkzeug zur Messung der Marktvolatilität, aber in seiner Standardform ist er nur eine einzelne, schwer lesbare Linie. Er zeigt Ihnen, ob die Volatilität hoch oder niedrig ist, aber nicht, wie man damit handelt.
Das ATR Advanced verwandelt diese grundlegende Kennzahl in ein vollständiges visuelles Handelssystem. Durch die Einführung einer Volatilitätssignallinie, richtungsweisenden Farbkerzen und eines Momentum-Histogramms zeigt es Ihnen nicht nur, wann sich der Markt bewegt, sondern genau, wie viel Kraft hinter dem aktuellen Trend steckt.
Hauptmerkmale der VOLLEN VERSION:
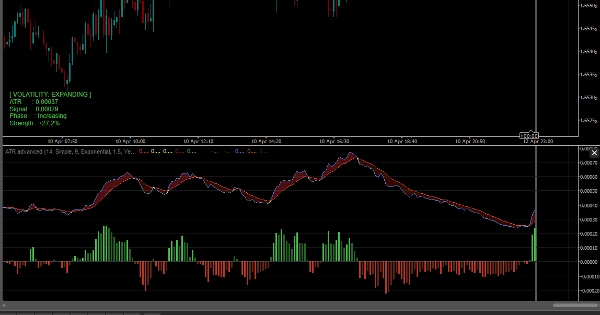
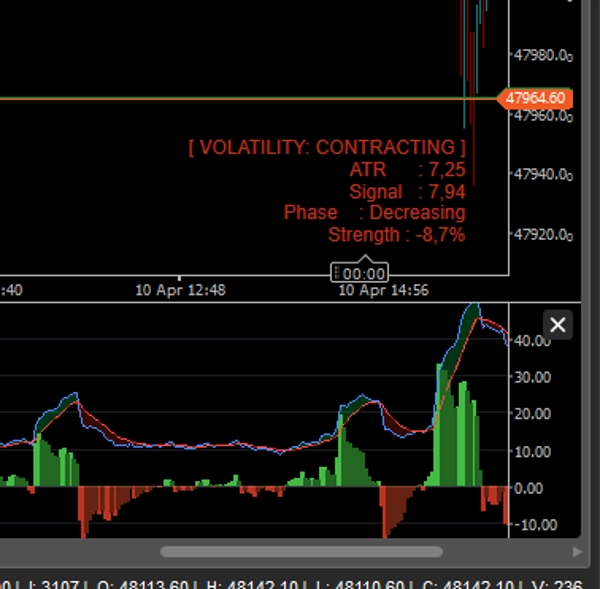
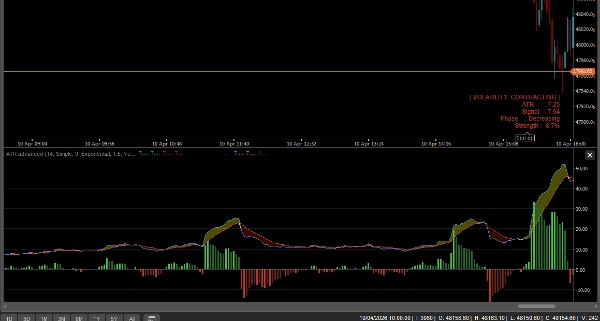
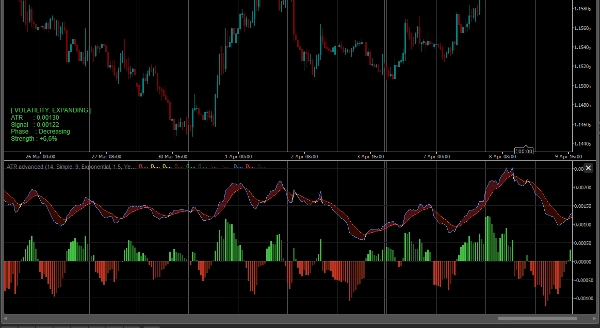
- Volatilitätserweiterungswolken: Wir haben dem ATR einen gleitenden Durchschnitt (Signallinie) hinzugefügt. Der Raum zwischen dem ATR und seiner Signallinie wird mit einer dynamischen Wolke gefüllt.
-
- Grüne Wolke (Erweiternd): Die Volatilität nimmt zu. Der Markt erwacht und die Trends sind stark.
- Rote Wolke (Zusammenziehend): Die Volatilität nimmt ab. Der Markt konsolidiert oder bewegt sich seitwärts.
- Momentum-Histogramm: Ein benutzerdefiniertes Histogramm am unteren Rand verfolgt die genaue Differenz zwischen dem ATR und der Signallinie und hilft Ihnen, Volatilitätsausbrüche zu erkennen, bevor sie sich vollständig manifestieren.
- Intelligente Balkenfärbung (Richtung + Volatilität): Dies ist das ultimative Merkmal. Der Indikator liest sowohl die Kursrichtung (bullisch/bärisch) ALS AUCH den Volatilitätszustand und färbt Ihre Kerzen entsprechend:
-
- Hellgrün/Rot: Starker Trend + zunehmende Volatilität (perfekt für Ausbruch- und Trendhandel).
- Dunkelgrün/Rot: Schwacher Trend + abnehmende Volatilität (Warnung: Momentum lässt nach).
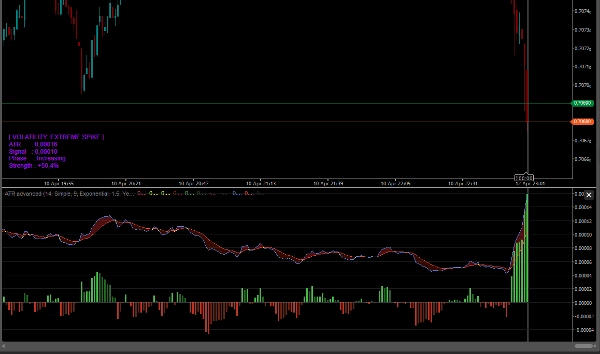
- Erkennung extremer Volatilität: Wenn der ATR ungewöhnlich stark ansteigt (z. B. während wichtiger Nachrichtenereignisse oder Blow-off-Tops), färben sich die Kerzen lila (extrem) und warnen vor einem möglichen Höhepunkt oder einem massiven Ausbruch.
- Echtzeit-Informationsdashboard: Ein elegantes Panel auf dem Chart zeigt den genauen ATR-Wert, die Volatilitätsphase (Erweiternd/Zusammenziehend) und eine prozentuale Stärkeanzeige.
- Vollständig freigeschaltet: Handeln Sie mit JEDEM Symbol (Forex, Krypto, Indizes, Aktien) und JEDEM Zeitrahmen ohne Einschränkungen. Lebenslanger Zugang.
Wie handelt man damit?
- Der Ausbruch: Vermeiden Sie das Handeln, wenn die Volatilitätswolke rot ist (zusammenziehend). Warten Sie, bis der ATR die Signallinie nach oben kreuzt (Wolke wird grün) und Ihre Kerzen hellgrün oder hellrot gefärbt sind. Dies bestätigt einen echten, hochwahrscheinlichen Ausbruch.
- Trailing Stops: Bleiben Sie in Ihren Gewinntrades, solange die Volatilitätswolke grün bleibt. Sobald sie nach unten kreuzt und rot wird, bedeutet dies, dass das Momentum erschöpft ist – ein guter Zeitpunkt, um Gewinne mitzunehmen.
- Climax-Warnung: Wenn Sie sich in einem Trend befinden und die Kerzen plötzlich lila werden, seien Sie vorsichtig! Dies stellt einen extremen Volatilitätsspitzenwert dar, der oft am Ende eines Trends kurz vor einer scharfen Umkehr auftritt.
Zusammenfassung
KI-Zusammenfassung
ATR Advanced is a volatility and trend indicator that enhances the standard Average True Range (ATR) by providing a comprehensive visual trading system. It integrates a Volatility Signal Line (a moving average of ATR) and fills the area between ATR and this line with dynamic Volatility Expansion Clouds. Green clouds indicate expanding volatility and strong trends, while red clouds signal contracting volatility and market consolidation.
Key features include a Momentum Histogram that tracks the difference between ATR and its Signal Line to identify volatility breakouts early, and smart bar coloring that reflects both price direction and volatility state. Bright green/red bars denote strong trends with expanding volatility, dark green/red bars indicate weak trends with contracting volatility, and purple bars warn of extreme volatility spikes often associated with trend climaxes or major events.
The indicator also includes a real-time on-chart dashboard displaying ATR values, volatility phases, and strength percentages. It supports all symbols—including Forex, cryptocurrencies, indices, and stocks—and any timeframe without limitations.
Traders can use it to confirm breakouts when volatility clouds turn green and bars brighten, manage trailing stops by monitoring volatility contraction, and receive warnings of potential trend reversals during extreme volatility spikes.
Key features include a Momentum Histogram that tracks the difference between ATR and its Signal Line to identify volatility breakouts early, and smart bar coloring that reflects both price direction and volatility state. Bright green/red bars denote strong trends with expanding volatility, dark green/red bars indicate weak trends with contracting volatility, and purple bars warn of extreme volatility spikes often associated with trend climaxes or major events.
The indicator also includes a real-time on-chart dashboard displaying ATR values, volatility phases, and strength percentages. It supports all symbols—including Forex, cryptocurrencies, indices, and stocks—and any timeframe without limitations.
Traders can use it to confirm breakouts when volatility clouds turn green and bars brighten, manage trailing stops by monitoring volatility contraction, and receive warnings of potential trend reversals during extreme volatility spikes.
Indikatorprofil
Indikatorkategorie
Momentum
Ausgabetyp
Visualisierung
Signale
Filter
Datenanforderungen
Nur Balken
Unterstützte Signale
Trendstärke
Volatilität
Diskussion
Kundenbewertungen
4.3
Bewertungen: 3
5 | 33 % | |
4 | 67 % | |
3 | 0 % | |
2 | 0 % | |
1 | 0 % |
Kundenbewertungen
April 24, 2026
20 signals gives enough for a first read, and the signal gets compared with context.
April 18, 2026
3 percent DD is the line to watch, and the log becomes easier to read.
Häufig gestellte Fragen (FAQ)
ATR
Moving Average
Über den cTrader Store verfügbare Produkte, einschließlich Handelsbots, Indikatoren und Plugins, werden von externen Entwicklern bereitgestellt und nur zu Informations- und technischen Zugriffszwecken verfügbar gemacht. cTrader Store ist kein Broker und erbringt keine Anlageberatung, persönlichen Empfehlungen oder eine Garantie für zukünftige Performance.






























Preis
32
Verkäufe
992
Kostenlose Installationen