

الوصف
مناطق دعم ومقاومة فيبوناتشي ديناميكية – التداول بمستويات على مستوى المؤسسات
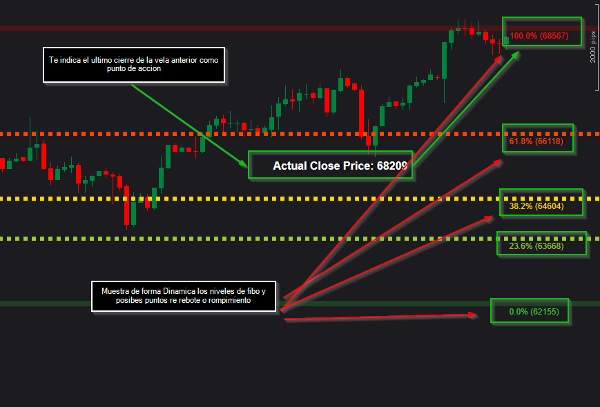
يقوم هذا المؤشر بتحويل تحليل فيبوناتشي التقليدي من خلال التركيز حصريًا على أجسام الشموع، مع تصفية الضوضاء الناتجة عن الفتائل التي غالبًا ما تخلق مستويات خاطئة. النتيجة: مناطق دعم ومقاومة دقيقة حيث يتفاعل السعر فعليًا.
المزايا الرئيسية للمتداولين:
- ديناميكي وآلي – لا حاجة للرسم اليدوي. يقوم المؤشر بإعادة حساب المستويات باستمرار بناءً على هيكل السعر الأحدث.
- مناطق ذات احتمالية عالية – يعرض أكثر مستويات فيبوناتشي موثوقية (0%، 23.6%، 38.2%، 61.8%، 100%) حيث يميل السعر إلى الانعكاس أو التماسك.
- مرجع السعر في الوقت الحقيقي – يعرض آخر سعر مغلق بالضبط في مركز نطاق فيبوناتشي، مما يمنحك وعيًا فوريًا بالوضع.
- تصميم بصري دقيق – المستويات القصوى (0% و100%) أكثر سمكًا وشبه شفافة لتحقيق تسلسل بصري أفضل. تسميات النصوص مرتبة بعناية فوق كل خط.
- قابل للتخصيص بالكامل – يمكنك تشغيل أو إيقاف أي مستوى، وضبط سمك الخط، حجم النص، وفترات النظر للخلف لتناسب أي إطار زمني أو استراتيجية.
- لا إعادة رسم، لا تأخير – الحسابات تعتمد على الشموع المغلقة المؤكدة. إشارات موثوقة وصادقة.
الميزة على أدوات فيبوناتشي القياسية:
تستخدم معظم الأدوات القمم والقيعان بما في ذلك الفتائل، مما يولد مناطق خاطئة. يستخدم هذا المؤشر أجسام الشموع فقط، مما يعكس قرارات السوق الحقيقية التي يتخذها المشترون والبائعون.
مثالي لـ:
- المتداولين المتأرجحين الباحثين عن مناطق انعكاس
- المتداولين السريعين الذين يحتاجون إلى مراجع دعم/مقاومة سريعة
- متداولي الاختراق الذين يراقبون العتبات الرئيسية
- أي متداول يقدر المستويات النظيفة والقابلة للتنفيذ
الميزة التشغيلية:
اتخذ قرارات تداول أسرع وأكثر ثقة بمعرفة المكان الدقيق الذي من المحتمل أن يتوقف فيه السعر أو ينعكس أو يتسارع.
الملخص
AI summary
Analisis Fibo Mejorado is a dynamic Fibonacci support and resistance indicator designed for trading platforms. It calculates key Fibonacci levels (0%, 23.6%, 38.2%, 61.8%, 100%) based exclusively on candle bodies rather than wicks, aiming to reduce noise and highlight true market reaction zones. The indicator automatically updates these levels in real time using the most recent price structure, eliminating the need for manual drawing.
Key features include a clear visual hierarchy with thicker, semi-transparent lines for extreme levels, customizable display options (line thickness, text size, lookback periods), and reliable signals based on closed candles to avoid repainting or lag. It shows the last closed price centered within the Fibonacci range to provide immediate price context.
This tool is suitable for various trading styles such as swing trading, scalping, and breakout strategies, offering precise, actionable support and resistance zones. It supports level-touch signals and requires bar data input. The indicator aims to assist traders in identifying high-probability reversal or consolidation areas to make faster, more confident decisions.
ملف تعريف المؤشر
فئة المؤشر
الدعم والمقاومة
نوع المخرجات
الإشارات
متطلبات البيانات
أعمدة السعر فقط
الإشارات المدعومة
لمس المستوى
تقييمات العملاء
0.0
التقييمات: 0
تقييمات العملاء
لا توجد تقييمات لهذا المنتج حتى الآن. هل جرَّبته بالفعل؟ كن أول من يخبر الآخرين!
مناقشة
الأسئلة الشائعة
Fibonacci
ADX
Bollinger Bands
Breaker Block
Channel
ATR
Support & Resistance
يتم توفير المنتجات المتاحة من خلال cTrader Store، بما في ذلك روبوتات التداول والمؤشرات والإضافات، من قبل مطوري الطرف الثالث وإتاحتها لأغراض الوصول المعلوماتي والفني فقط. cTrader Store ليس وسيطًا ولا يقدم نصائح استثمارية أو توصيات شخصية أو أي ضمان للأداء المستقبلي.
المزيد من هذا المؤلف





السعر
منذ 08/05/2026