
説明
LTtradingBoxとは?
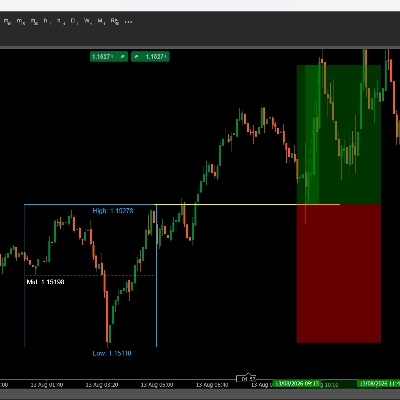
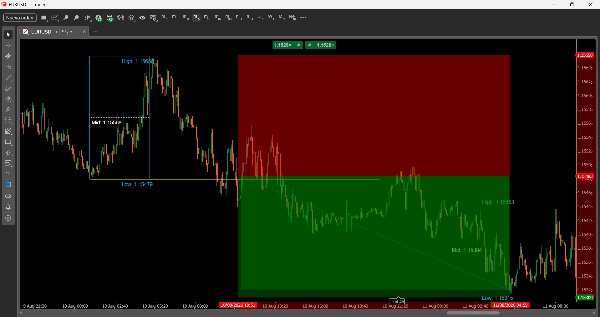
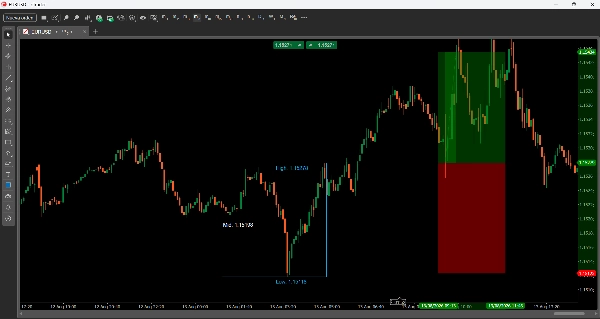
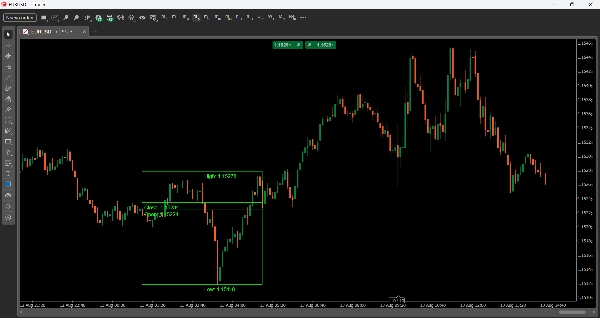
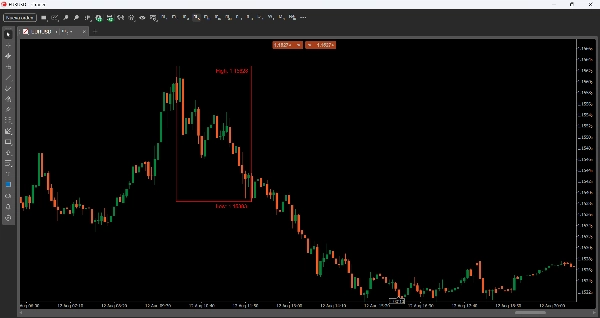
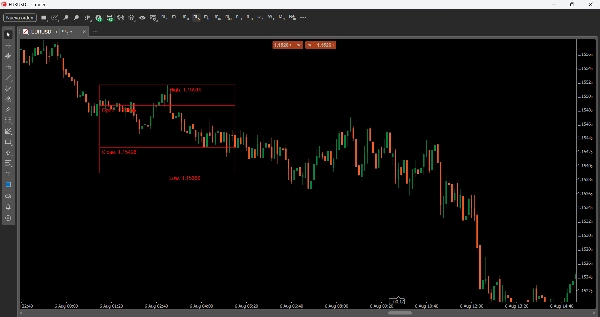
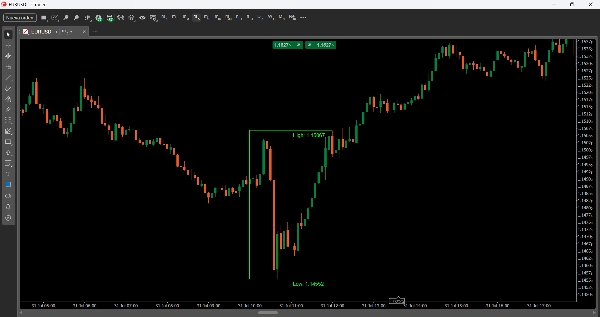
LTtradingBoxは、あなたが定義した時間枠の価格範囲(高値、安値、始値、終値)を視覚的にマークします。例えばロンドンやニューヨークのセッションなどです。ボックスはそのセッションの結果に基づいて自動的に色が変わります:強気で終わった場合は緑、弱気で終わった場合は赤、中立の場合は灰色(または各ケースに選択した色)。また、参照線(ミッドプライス、ミッドタイム)とオプションの視覚的な塗りつぶしを追加し、流動性ゾーン、蓄積範囲、取引すべき重要なレベルを一目で見つけやすくします。
パラメーター
時間設定
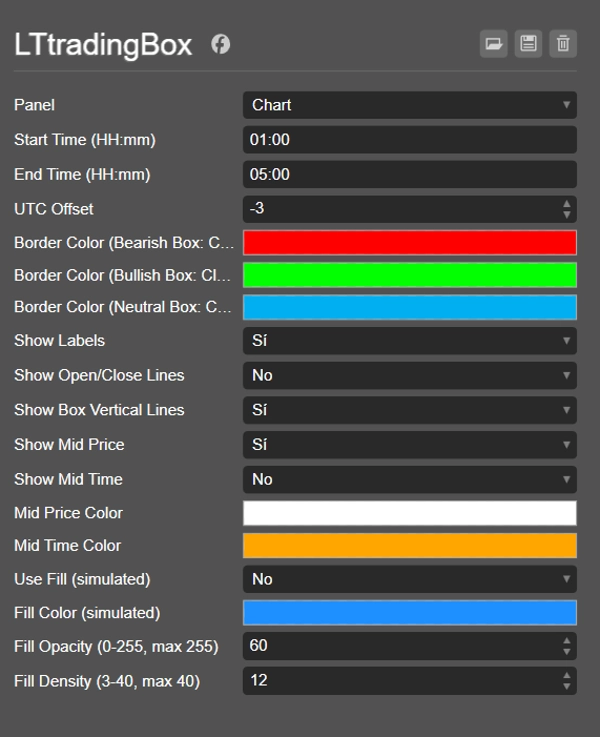
- 開始時間(HH:mm) — ボックスの開始時間(24時間形式)。
- 終了時間(HH:mm) — ボックスの終了時間。
- UTCオフセット — あなたのローカル時間や追跡したいセッション(例:ロンドン、NY、アジア)に合わせてボックスを調整する時間設定。ブローカーのタイムゾーンに関係なく適用されます。
色設定
- ボーダーカラー(弱気ボックス:終値 < 始値) — ボックスが弱気で終わったときのボーダーカラー。
- ボーダーカラー(強気ボックス:終値 > 始値) — ボックスが強気で終わったときのボーダーカラー。
- ボーダーカラー(中立ボックス:終値 == 始値) — 終値と始値が同じ場合のボーダーカラー。
表示オプション
- ラベル表示 — 高値、安値、始値、終値のテキストラベルの表示切替。
- 始値/終値ライン表示 — ボックス内の始値と終値を示す水平線を描画。
- ボックス垂直ライン表示 — 四辺全ての矩形を有効にします。無効の場合は高値と安値のラインのみ表示。
- ミッドプライス表示 — 高値と安値の中間点に点線を描画。
- ミッドタイム表示 — ボックスの時間の中間点に垂直線を描画。
- ミッドプライス色 / ミッドタイム色 — それらのラインのカスタマイズ可能な色。
塗りつぶし(視覚的塗りつぶし)
- 塗りつぶしを使用(シミュレート) — ボックス内にシミュレートされた塗りつぶしを有効にします(重ねられた細い線を使用)。
- 塗りつぶし色(シミュレート) — 塗りつぶしの色。
- 塗りつぶし不透明度(0-255、最大255) — 塗りつぶしの透明度レベル。
- 塗りつぶし密度(3-40、最大40) — 塗りつぶしをシミュレートするために使用される線の数(密度が高いほど塗りつぶしが濃くなります)。
トレーディングアイデア
- ブレイクアウトとリテスト:価格がボックスの高値または安値を突破し、そのレベルをサポート/レジスタンスとしてリテストするのを待ってから、ブレイクアウト方向にエントリーします。
- 極値での反転:価格がボックスの高値または安値に触れても強く突破しなかった場合、拒否のサインとなり、ボックスの反対側への動きを示す可能性があります。
- セッションごとの方向性バイアス:ボックスの色はそのセッションの動きを素早く示すバイアス(強気/弱気/中立)を提供し、後のセッションでのエントリーの整合に役立ちます。
- ミッドプライスを磁石として:中間点はしばしばリバランスゾーンとして機能します。強いインパルスムーブの後に価格がミッドに戻るときにエントリーを探します。
- 連続するボックスの比較:各日次ボックスは日付タグで保存されるため、複数の連続セッションのレンジとバイアスを比較して短期トレンドを見つけることができます。
概要
AIによる概要
LTtradingBox is a customizable trading indicator that visually highlights the price range—high, low, open, and close—within any user-defined time window, such as a specific trading session. The indicator draws a colored box representing this range, automatically changing its border color to green for bullish closes, red for bearish closes, or gray for neutral, with customizable color options. It includes reference lines for the midpoint price and midpoint time, which can be displayed as dotted or vertical lines, aiding in identifying liquidity zones, accumulation areas, and key support/resistance levels.
Users can configure start and end times, apply a UTC offset to align with local or session times, and toggle display options such as labels for price points, open/close lines, full box borders, and visual fills with adjustable color, opacity, and density. The indicator supports trading strategies including breakout and retest of box boundaries, reversal signals at extremes, session-based directional bias, and using the midpoint as a rebalancing zone. It also allows comparison of consecutive session boxes to detect short-term trends. LTtradingBox is designed to assist traders in quickly identifying key levels and market structure within chosen timeframes.
Users can configure start and end times, apply a UTC offset to align with local or session times, and toggle display options such as labels for price points, open/close lines, full box borders, and visual fills with adjustable color, opacity, and density. The indicator supports trading strategies including breakout and retest of box boundaries, reversal signals at extremes, session-based directional bias, and using the midpoint as a rebalancing zone. It also allows comparison of consecutive session boxes to detect short-term trends. LTtradingBox is designed to assist traders in quickly identifying key levels and market structure within chosen timeframes.
インジケーターのプロフィール
インジケーターのカテゴリー
サポート&レジスタンス
出力の種類
ビジュアル表示
データ要件
バーのみ
サポート対象のシグナル
ブレイクアウト
反転
ラインブレイク
ラインタッチ
カスタマーレビュー
0.0
レビュー: 0
カスタマーレビュー
この商品にはまだレビューがありません。お使いになったことがある方は、ぜひレビューをお願いします。
ディスカッション
よくあるご質問
Key Levels
Support & Resistance
cTrader Storeで入手可能な取引ボット、インジケーター、プラグインなどの商品は、第三者の開発者が提供するものであり、情報と技術の取得のみを目的としてご利用いただけます。cTrader Storeはブローカーではなく、投資助言や個人的な推奨を行うことも、将来のパフォーマンスを保証することもありません。


















価格
登録日 10/01/2025