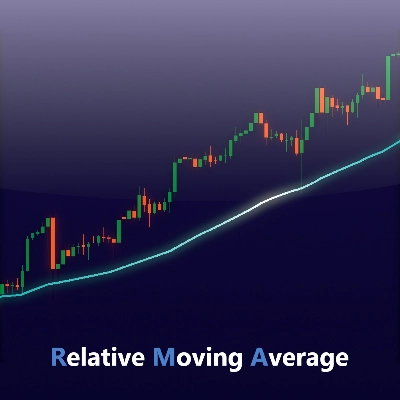
Przedstawiamy wskaźnik Relative Moving Average (RMA), teraz dostępny dla cTrader!
Relative Moving Average (RMA) — znany również jako Smoothed Moving Average (SMMA) — to rodzaj średniej kroczącej, która ma na celu zmniejszenie opóźnienia przy zachowaniu płynności krzywej. To ta sama formuła, którą wykorzystuje wbudowana funkcja „RMA” TradingView, szeroko stosowana w popularnych wskaźnikach, takich jak Relative Strength Index (RSI).
RMA została zaprojektowana tak, aby znaleźć równowagę między szybkością reakcji a stabilnością. Aktualizuje się płynniej niż Exponential Moving Average (EMA), ale reaguje szybciej na zmiany cen niż Simple Moving Average (SMA).
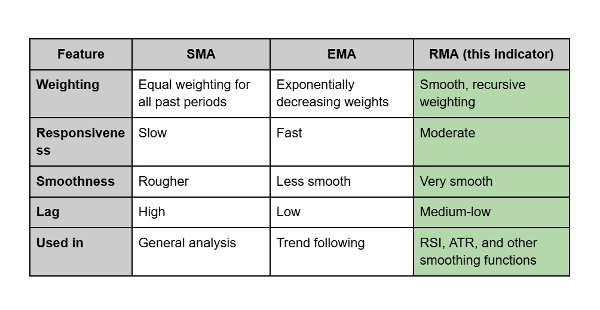
Czym się różni:
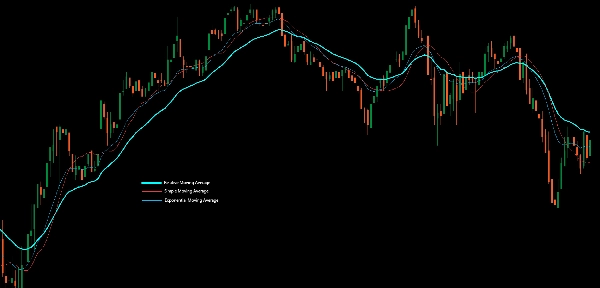
- SMA uśrednia wszystkie ceny jednakowo, co powoduje opóźnienia i niestabilność.
- EMA nadaje większą wagę ostatnim cenom, dzięki czemu jest bardzo responsywna, ale czasem hałaśliwa.
- RMA natomiast łączy zalety obu: wygładza zmienność, jednocześnie utrzymując terminowe reakcje na zmiany cen.
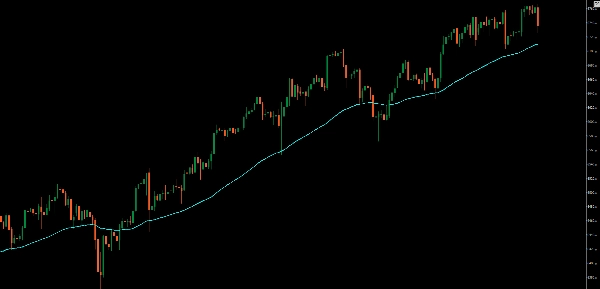
Praktyczne zastosowanie:
Traderzy często używają RMA jako wygładzoną linię trendu lub jako część wskaźników momentum. Jest szczególnie skuteczna, gdy chcesz odfiltrować szumy bez wprowadzania znaczącego opóźnienia — idealna do potwierdzania długoterminowych trendów lub wspierania analiz wykupienia/przeciążenia rynku.


