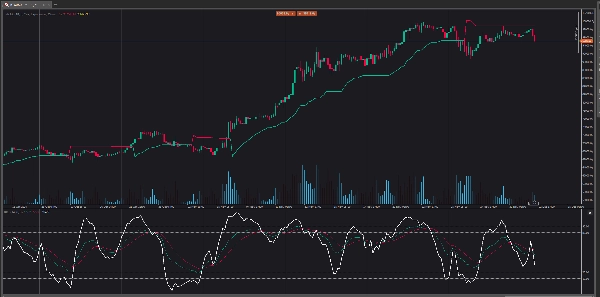
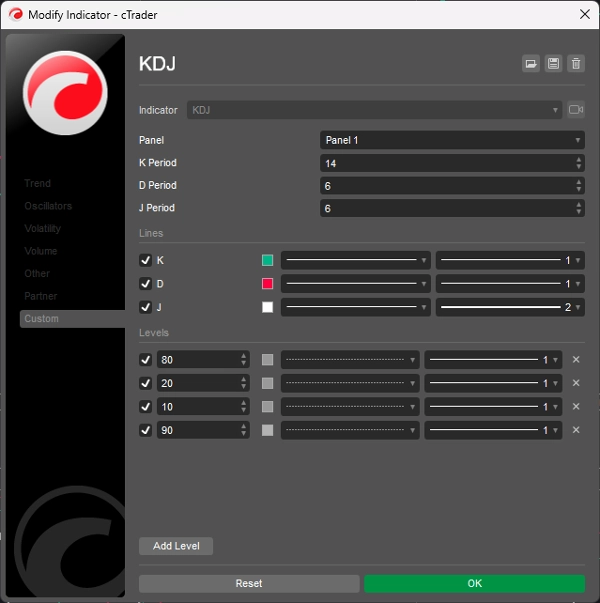
KDJ
"KDJ" 로고
5.0
03/09/2025
163
Desktop
가입일 03/10/2024
판매
1
무료 설치
5426
"KDJ" 업로드된 이미지"KDJ" 업로드된 이미지

The KDJ oscillator display consists of 3 lines (K, D and J - hence the name of the display) and 2 levels. K and D are the same lines when using the stochastic oscillator. The J line represents the deviation of the D value from the K value. The convergence of these lines indicates new trading opportunities. Like the Stochastic Oscillator, oversold and overbought levels correspond to the times when the trend is likely to reverse.

5.0
리뷰: 1
5
100 %
4
0 %
3
0 %
2
0 %
1
0 %
고객 리뷰
August 18, 2025
Pros: Three-line stochastic oscillator (K, D, J) that identifies overbought/oversold levels and momentum shifts. Supports divergence analysis and crossovers between K and D as trading signals. Lightweight and responsive. Cons: No alerts, tooltips, or settings presets. J‑line can generate outlier v
이 작성자의 상품 더 보기
최고 평점
무료
지표
ATR
Supertrend
PMAX
It's a combination of two trailing stop loss and the other one is well-known ATR-based SuperTrend.
cBot
VWAP
RSI
Breakout
+5
Investion X V1.9 - Intelligent Filter-Based Trading System
Trading system combining martingale strategy with multi-layered technical analysis and comprehensive protection features
지표
Indices
AI
Machine Learning Momentum Index
The Machine Learning Momentum Index (MLMI) represents the next step in oscillator trading.
지표
RSI
Indices
StochasticRSI
Stochastic RSI (StochRSI) is a technical indicator used to measure the strength and weakness of the RSI.
Laguerre RSI
Laguerre RSI is based on John EHLERS' Laguerre Filter to avoid the noise of RSI.
지표
Breakout
Forex
On Balance Volume
On Balance Volume (OBV) measures buying and selling pressure as a cumulative indicator.
Quantitative Qualitative Estimation
The QQE (Quantitative Qualitative Estimation) Weighted Oscillator improves its original version by weighting the RSI.
지표
Breakout
Stocks
Signal
Darvas Box
The Darvas Box involves identifying "boxes" or trading ranges where a stock's price consolidates before breaking out.
지표
Indices
Breakout
Stocks
+3
Ichimoku Cloud Indicator
The Ichimoku Cloud is a comprehensive technical analysis system developed by Japanese journalist Goichi Hosoda
Chaikin Money Flow
Chaikin money flow's primary purpose is to distinguish between periods of accumulation and distribution of a security.
cBot
Grid
Martingale
Investion Basic
This is a basic martingale bot without an indicator. For long and short trading options at the same bot.
좋아하실 만한 다른 항목
지표
RSI
Breakout
Supertrend
TrendMaster Pro MultiMA
Connects each moving average value from candle to candle, forming a fan-like structure of trendlines.
지표
Forex
ms_Candle_ColseTime
⏱ Candle Time Remaining – Real-Time Candle Countdown Indicator
지표
NZDUSD
Breakout
FVG
+7
SmartMoneyConceptsIndicator
Automatically displays "Smart Money Concepts" used by professional traders.
지표
Prop
ATR
ADT_bigCandles
Outside Candle Detector: Highlights major candles/zones with ATR filter & pattern labels. By Avydel Talbo, prop trader.
지표
Indices
E7 BlackScholes Model
Option pricing using the BlackScholes model and the Math.Numerics packages
지표
NZDUSD
Forex
EURUSD
+2
AlgoCorner Market Sessions
Show each Market Session with full details, including grid mode for higher timeframes, statistics, and other metrics.
지표
VWAP
RSI
Breakout
+7
Anchored VWAP by LudwigICT
📈 Anchored VWAP with auto High/Low, session resets, Daily VWAP & TWAP — precise, Pine-accurate port.
지표
Bollinger
E7 Indicators Free Overlays
Bollinger Band Cloud, Heiken Ashi, Trend Follower and Parabolic SAR.
지표
Indices
RSI
XAUUSD
+8
RSI Trend Trigger
RSI Trend Trigger 📈: Uses dual-layer RSI to spot trends & generate clear buy/sell signals.
지표
Indices
Stocks
Commodities
+2
Series - FXMaster
Consecutive Series Moves — Reveal the True Pulse of Price Action
지표
VWAP
VWAP - London Open
VWAP Set to London Open
IR Open Connector
This indicator connects the opening prices of higher timeframe candles (Daily, Weekly, Monthly, or
Microchannels
Microchannels
[Stellar Strategies] Market Session Ultimate
Ultimate Session Tool: Boxes, OR, KZs, PD Levels, Overlaps, Custom Lines & Names, Info Panel! Highly customizable 📉📈
지표
Indices
Stocks
Forex
+1
Bullet Chart Trend
Unique Pyramid Design , Clear Price Action Trend
LDE - Market Sessions
🇫🇷 Visualisez vos sessions de marché et OPR d'un coup d’œil 🇬🇧 Visualize your market sessions & OPR at a glance !
지표
Indices
RSI
Signal
+1
[Stellar Strategies] QQE
The QQE indicator is a technical analysis tool designed to identify potential trend changes and trading signals 📈📉
지표
Signal
[Stellar Strategies] Wave Trend Pro
Momentum oscillator identifying reversals using dual WaveTrend lines, histogram, and OB/OS levels with optional signals.