설명
Trend Scope Pro는 거래자에게 시장 구조와 가격 방향에 대한 더 깊은 이해를 제공하도록 설계된 전문가급 기술 지표입니다. 고급 선형 회귀 알고리즘을 기반으로 구축된 이 도구는 동적 회귀선과 세 가지 표준 편차 채널 수준을 계산합니다. 통계적 정확성과 시각적 명확성을 결합하여 현재 시장 추세, 잠재적 반전 구역 및 변동성 범위를 쉽게 식별할 수 있도록 도와줍니다. 이는 모든 거래 도구 키트에 접근 가능하면서도 강력한 추가 기능입니다.
Trend Scope Pro 읽는 방법
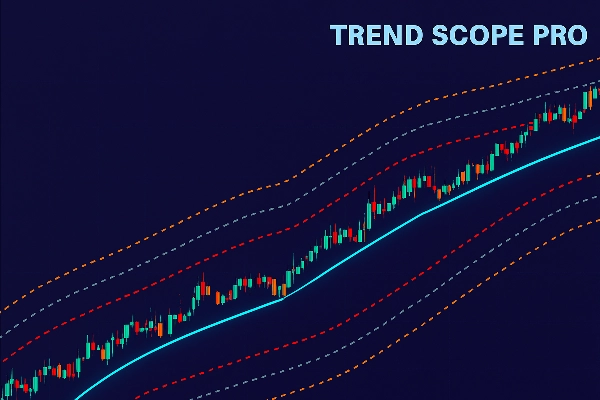
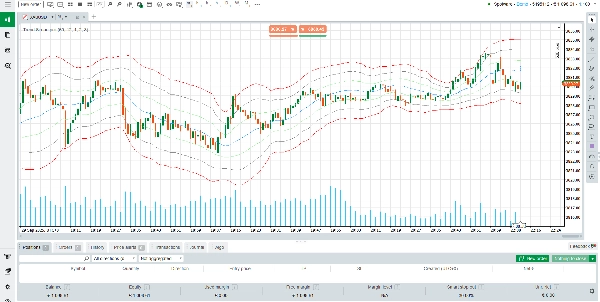
차트에 적용하면 Trend Scope Pro는 중앙 회귀선(파란색)을 그리는데, 이는 정의된 기간 동안의 “공정 가치” 또는 평균 추세 방향을 나타냅니다. 이 선 주위에는 세 세트의 상단 및 하단 채널(주황색, 회색, 빨간색)이 표시됩니다. 각 채널은 서로 다른 표준 편차 배수를 사용하여 계산됩니다:
상단/하단 1 (주황색): 첫 번째 표준 편차를 나타냅니다. 이 구역 내 가격 움직임은 종종 정상적인 단기 변동성을 반영합니다.
상단/하단 2 (회색): 더 강한 편차를 표시합니다. 이 구역에 도달하면 종종 확장된 움직임이나 모멘텀 형성을 신호합니다.
상단/하단 3 (빨간색): 시장이 과매수 또는 과매도 상태일 수 있는 극단적인 구역으로, 잠재적 반전 기회를 만듭니다.
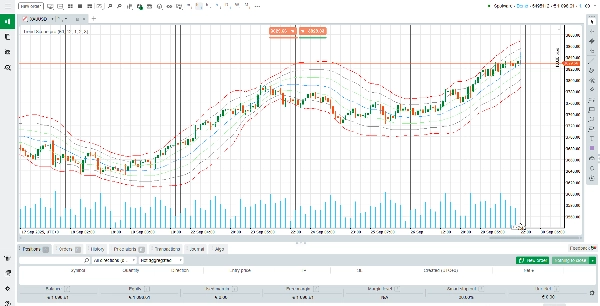
실제로 거래자는 회귀선을 사용하여 추세 방향을 확인할 수 있으며, 채널은 동적 지지 및 저항 수준으로 작용합니다. 예를 들어:
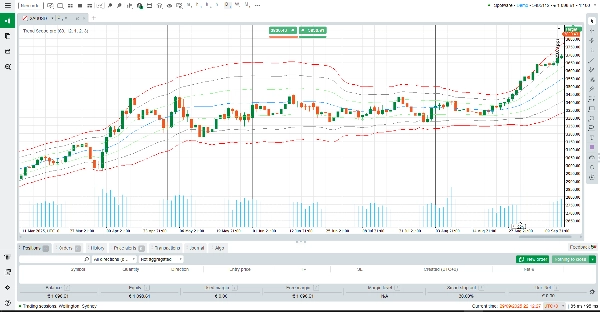
가격이 지속적으로 회귀선 위에 머물면 추세는 강세입니다.
가격이 반복적으로 회귀선을 테스트하거나 하락 돌파하면 추세가 약화되고 있습니다.
빨간색 채널에서의 극단적인 접촉은 피로 지점을 강조할 수 있으며, 이곳에서 반전이나 되돌림이 더 가능성이 높습니다.
지표 작동 방식
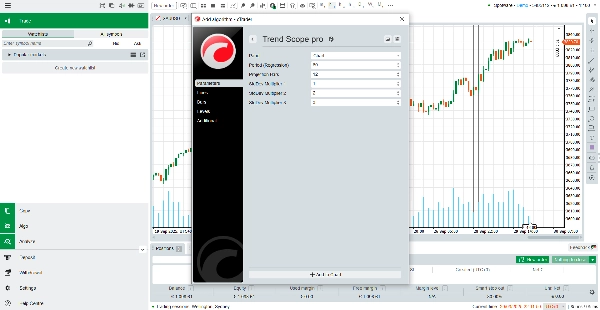
Trend Scope Pro는 선택한 되돌아보기 기간 동안 종가를 분석하여 회귀선을 계산합니다. 그런 다음 이 선으로부터 가격의 표준 편차를 측정하여 각 채널의 폭을 결정합니다. 이 통계적 접근 방식은 지표가 실시간 변동성에 적응하도록 하여 추세 추종 신호와 평균 회귀 통찰력 사이의 균형을 제공합니다.
기본 설정(60봉 되돌아보기, 배수 1.0, 2.0, 3.0)은 대부분의 도구에 최적화되어 있지만, 전략이나 시간 프레임에 맞게 쉽게 조정할 수 있습니다. 일중 진입을 찾는 데이 트레이더이든, 더 넓은 시장 주기를 분석하는 스윙 트레이더이든, Trend Scope Pro는 의사 결정에 신뢰할 수 있는 맥락을 제공합니다.
Trend Scope Pro의 주요 특징
적응형 선형 회귀 – 정확한 방향성 편향을 위해 중앙 시장 추세를 동적으로 계산합니다.
다중 수준 채널 – 세 세트의 편차 밴드는 정상 움직임, 강한 추세 및 극단적 조건을 식별하는 데 도움을 줍니다.
시각적 명확성 – 깔끔하고 색상으로 구분된 선들은 가격 움직임을 한눈에 해석하기 쉽게 만듭니다.
사용자 정의 가능 설정 – 모든 거래 스타일에 맞게 유연한 되돌아보기 기간과 편차 배수를 제공합니다.
요약하자면, Trend Scope Pro는 통계적 신뢰성과 실용적 사용성을 결합합니다. 단순한 추세선 그 이상으로, 가격 행동을 분석하고, 높은 확률의 구역을 식별하며, 거래 타이밍을 개선하기 위한 완전한 프레임워크입니다. 추세 확인을 원하든, 반전을 예상하든, 단순히 차트에 구조를 추가하든, Trend Scope Pro는 필요한 명확성과 자신감을 제공합니다.
요약
고객 리뷰
5 | 50 % | |
4 | 50 % | |
3 | 0 % | |
2 | 0 % | |
1 | 0 % |


