설명
간단한 설명
트렌드 & 볼륨 레짐 맵은 가격과 거래량의 방향성과 지속성을 측정하는 cTrader용 레짐 필터입니다. 정규화된 트렌드 점수와 볼륨 트렌드 점수를 –10에서 +10 범위 내에서 제공하며, 촛대를 약세 빨간색에서 강세 초록색으로 부드러운 그라데이션으로 색칠하고 현재 환경이 위험 선호, 위험 회피 또는 단순히 노이즈인지 보여줍니다.
🧠 기능
이 지표는 TradingView의 BigBeluga의 “Regime Filter” 논리를 cTrader에 맞게 변형하고 명확한 트렌드 & 볼륨 레짐 맵으로 포장한 것입니다.
부드럽게 처리된 가격 & 거래량
- 가격을 부드럽게 하기 위해 HLC3(고가, 저가, 종가의 평균)를 계산하고 Hull 이동평균(HMA)을 적용합니다.
- 틱 거래량에 또 다른 Hull 이동평균을 적용합니다.
트렌드 점수 (가격)
- 최근 N개 바 (
Length) 동안 현재 가격의 HMA를 과거 각 HMA 값과 비교합니다:
- 현재 HMA > 과거 HMA → 트렌드 +1
- 현재 HMA ≤ 과거 HMA → 트렌드 –1
- 누적 점수는 –10 … +10 범위로 조정되며 → 이것이 트렌드 값입니다.
볼륨 트렌드 점수
- 같은 논리를 사용하지만 거래량 HMA에 적용됩니다.
- 결과는 또 다른 정규화된 점수로 –10 … +10 범위 내에 있으며 → 이것이 볼륨 값입니다.
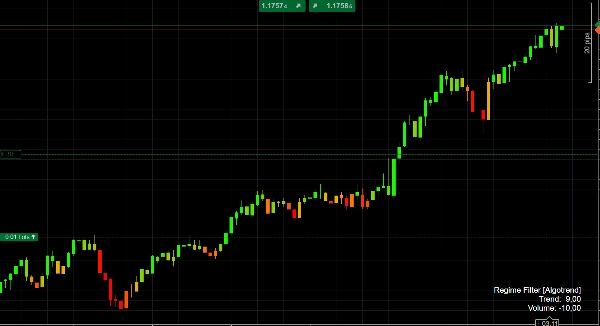
색상 논리
- 트렌드 점수가 음수일 때, 촛대는 하락 레짐의 강도에 따라 빨강 → 주황 그라데이션으로 색칠됩니다.
- 트렌드 점수가 양수일 때, 촛대는 주황 → 라임 색으로 칠해지며, 강한 상승 레짐일수록 더 강한 녹색을 가집니다.
이를 통해 가격 움직임이 약세, 중립, 또는 강세인지와 현재 레짐의 지속성을 즉시 시각적으로 파악할 수 있습니다.
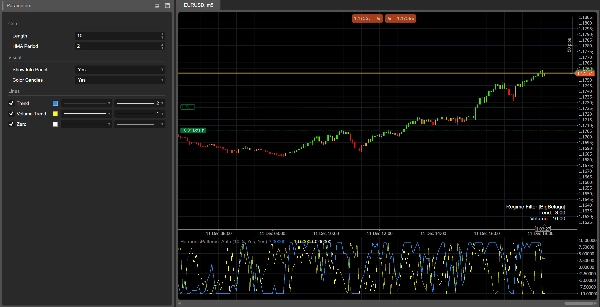
레짐 패널
서브 윈도우에 지표는 다음을 표시합니다:
- 트렌드 라인 (파란색)
- 볼륨 트렌드 라인 (회색)
- 제로 라인 (기준선)
마지막 바에는 현재 트렌드와 볼륨 값을 보여주는 작은 정보 패널이 표시됩니다.
🎯 사용 방법
트렌드 확인
- 강한 레짐 방향으로만 거래하세요, 예를 들어:
- 트렌드 > +4 → 매수 편향
- 트렌드 < –4 → 매도 편향
레짐 필터
- 레짐이 약할 때(트렌드가 0 근처) 또는 볼륨 트렌드가 강하게 음수일 때 전략을 중단하거나 축소하세요. 이는 종종 횡보하거나 약해지는 움직임을 나타냅니다.
신호에 대한 맥락
기존 진입 신호(가격 움직임, 하모닉 패턴, 오실레이터 등)를 트렌드 & 볼륨 레짐 맵과 결합하여 거시 필터로 사용하세요:
- 트렌드가 양수이고 볼륨 트렌드도 양수일 때만 돌파를 취하세요.
- 트렌드가 매우 강할 때(> +8 또는 < –8)는 시장이 강력한 방향성 레짐에 있으므로 평균 회귀 설정을 피하세요.
⚙️ 입력 매개변수
핵심
길이
트렌드 및 볼륨 점수를 계산하는 데 사용되는 바의 수입니다.
- 값이 클수록 → 더 부드럽고 “거시적”인 레짐; 변화는 느리지만 더 안정적입니다.
- 값이 작을수록 → 반응은 빠르지만 노이즈와 빈번한 반전이 많습니다.
HMA 기간
가격과 거래량 모두를 부드럽게 하는 데 사용되는 Hull 이동평균의 기간입니다.
- 시간 프레임과 거래 스타일에 맞게 조정하세요: 낮은 시간 프레임에는 짧게, 높은 시간 프레임에는 길게 설정합니다.
시각적
정보 패널 표시
마지막 바에 현재 트렌드와 볼륨 점수를 보여주는 작은 텍스트 패널을 표시하거나 숨깁니다.촛대 색상
트렌드 값(빨강 / 주황 / 초록 그라데이션)에 따라 촛대 색상을 활성화합니다. 기본 차트 색상을 유지하려면 끄세요.
✅ 해석 요약
- 트렌드 ≥ +7 → 강한 강세 레짐, 촛대는 밝은 초록색.
- 트렌드 +3에서 +7 사이 → 강세 편향; 되돌림은 잠재적 매수 구간입니다.
- 트렌드 –3에서 +3 사이 → 횡보 / 변동성; 신호 신뢰도 낮음.
- 트렌드 ≤ –7 → 강한 약세 레짐, 촛대는 진한 빨간색.
- 볼륨 트렌드 > 0 → 상승 / 지속 활동, 움직임이 “진짜”이고 지속될 가능성이 높음.
- 볼륨 트렌드 < 0 → 참여 감소, 가짜 움직임, 횡보 또는 반전 위험 증가.
요약
고객 리뷰
5 | 0 % | |
4 | 100 % | |
3 | 0 % | |
2 | 0 % | |
1 | 0 % |


