Opis
https://chartshots.spotware.com/c/695bec6c74055
https://chartshots.spotware.com/c/695bed35bf7b7
https://chartshots.spotware.com/c/695bed6b139df
https://chartshots.spotware.com/c/695bed8ea6bdb
📊 BLOKADA PIVOT BREAKER
🤔
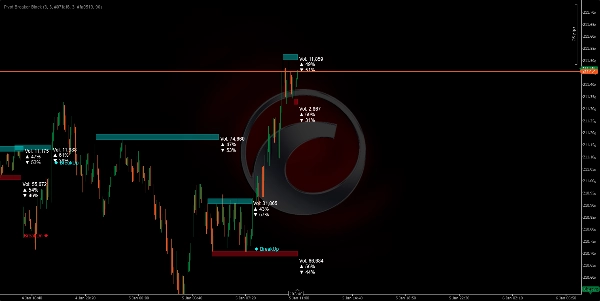
Blokada Pivot Breaker to wizualny wskaźnik, który automatycznie identyfikuje kluczowe punkty zwrotne cen (lokalne maksima i minima) i buduje "bloki cenowe" wokół tych krytycznych poziomów. Gdy cena ponownie zbliża się do tych podobnych poziomów, algorytm rysuje prostokąty (strefy) reprezentujące opór (podaż) oraz wsparcie (popyt).
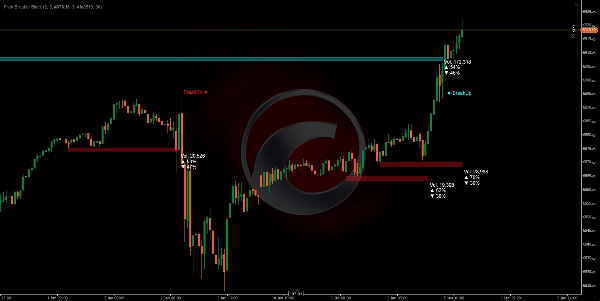
System nieustannie monitoruje, czy cena przebija te strefy, generując wyraźne sygnały wizualne: BreakUp (wybicie wzrostowe) 🔼 lub BreakDn (wybicie spadkowe) 🔽.
DO CZEGO TO SŁUŻY? 🎯
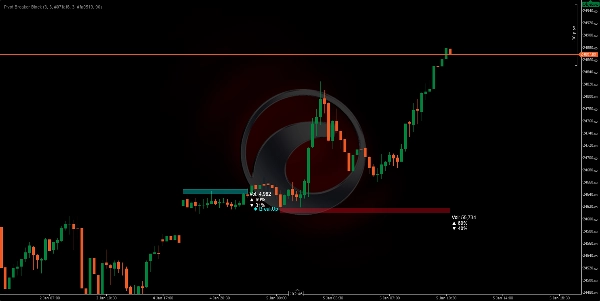
1. Identyfikacja stref kontroli rynku 🗺️
Algorytm wykrywa miejsca, gdzie cena wykazała silny opór (sufit sprzedaży) lub wsparcie (podłoga kupna). Gdy te poziomy pojawiają się wielokrotnie, rynek potwierdza ich znaczenie.
2. Wizualizacja akumulacji i dystrybucji wolumenu ⚖️
Każdy blok pokazuje:
- Całkowity wolumen przetworzony w tej strefie
- % kupna (świece wzrostowe) 📈
- % sprzedaży (świece spadkowe) 📉
Pozwala to zobaczyć, czy rynek kupuje czy sprzedaje w danym obszarze, ujawniając intencję rynku.
3. Przewidywanie punktów wybicia 🚨
Gdy cena zbliża się do tych stref, masz największe prawdopodobieństwo znaczącego ruchu. Algorytm automatycznie wykrywa przebicia i ostrzega Cię w czasie rzeczywistym.
JAK DZIAŁA LOGIKA ⚙️
Faza 1: Wykrywanie pivotów (punktów zwrotnych) 🔍
Algorytm szuka maksimów i minimów spełniających określone kryterium:
- Pivot High: Świeca, której maksimum jest wyższe niż 5 poprzednich i 5 kolejnych świec.
- Pivot Low: Świeca, której minimum jest niższe niż 5 poprzednich i 5 kolejnych świec.
Ten parametr "5" (Pivot Lookback) jest regulowany w zależności od zmienności, którą chcesz uchwycić.
Faza 2: Rozpoznawanie stref kontroli 🎯
Po zidentyfikowaniu pivotu system porównuje go z poprzednim pivotem tego samego typu. Jeśli różnica między nimi jest mniejsza niż 20% ATR (aktualny wskaźnik zmienności), oznacza to, że rynek ponownie odwiedza wcześniej odrzucony podobny poziom.
Faza 3: Określanie rozmiaru strefy 📏
Wysokość każdego bloku jest dynamicznie obliczana za pomocą ATR (Average True Range):
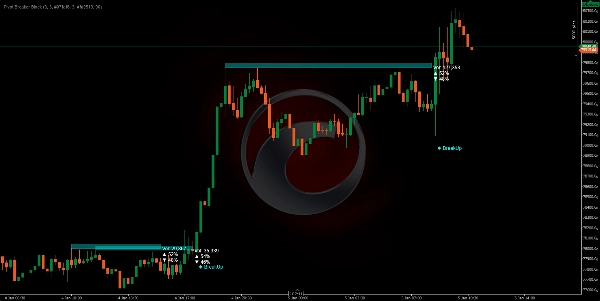
- Podaż (czerwony): Sufit jest ATR × 0,5 punktów powyżej pivotu.
- Popyt (cyjan): Podłoga jest ATR × 0,5 punktów poniżej pivotu.
Oznacza to, że strefy automatycznie dostosowują się do zmienności aktywa. Na rynkach zmiennych strefy są szersze; na spokojnych - węższe.
Faza 4: Analiza wolumenu w czasie rzeczywistym 💹
Gdy cena znajduje się w strefie, algorytm sumuje wszystkie wolumeny kupna i sprzedaży od momentu rozpoczęcia bloku:
- Kupno: Wszystkie świece, gdzie zamknięcie jest wyższe niż otwarcie (wolumen wzrostowy).
- Sprzedaż: Wszystkie świece, gdzie zamknięcie jest niższe niż otwarcie (wolumen spadkowy).
Te procenty pokazują dominującą intencję w danej strefie.
Faza 5: Wykrywanie wybicia 🚀
Algorytm monitoruje każdą nową świecę:
- BreakUp (↑): Zamknięcie przebija powyżej sufitu podaży → sygnał wybicia wzrostowego.
- BreakDn (↓): Zamknięcie przebija poniżej podłogi popytu → sygnał wybicia spadkowego.
Gdy to nastąpi, blok jest dezaktywowany, a na ekranie pojawia się sygnał tekstowy.
JAK GO UŻYWAĆ 🛠️
Instalacja i konfiguracja ⚙️
- Dodaj wskaźnik do platformy cTrader.
- Uzyskaj dostęp do regulowanych parametrów:
ParametrZnaczenieRekomendacja
Pivot Lookback
Ile świec w lewo/prawo jest ocenianych, aby potwierdzić pivot
5 (standard), zwiększ na wyższych interwałach czasowych
Współczynnik strefy podaży
Wysokość czerwonego bloku (opór)
5.0 (standard), dostosuj według preferencji
Współczynnik strefy popytu
Wysokość cyjanowego bloku (wsparcie)
5.0 (standard), dostosuj według preferencji
Przezroczystość
Nieprzezroczystość bloku (0=przezroczysty, 255=pełny)
90 (zalecane dla widoczności)
Kolory
Dostosuj wygląd wizualny
Czerwony dla podaży, cyjan dla popytu
Strategia handlowa 💡
Scenariusz 1: Wejście długie (Kupno) 📈
- Czekaj, aż cena utworzy blok popytu (cyjan) z % kupna > 55%.
- Po zobaczeniu BreakUp, potwierdź swoje bycze wejście.
- Stop Loss (SL) poniżej podłogi bloku.
Scenariusz 2: Wejście krótkie (Sprzedaż) 📉
- Szukaj bloku podaży (czerwony) z % sprzedaży > 55%.
- Na BreakDn, otwórz pozycję krótką.
- Stop Loss (SL) powyżej sufitu bloku.
Scenariusz 3: Odwrócenie (średnia rewersja) 🔄
- Jeśli cena znajduje się w bloku popytu ale % kupna jest niski (< 45%)...
- Przewiduj, że cena odbije się w górę bez osiągnięcia BreakUp.
- Wejdź w kupno blisko podłogi z Take Profit (TP) na suficie.
Optymalne interwały czasowe ⏰
- H4/D1: Bardziej znaczące bloki, ruchy o dłuższym czasie trwania.
- H1: Dobry balans między szumem a okazjami.
- M15: Szybkie wejście, wymaga potwierdzenia wolumenu.
Podsumowanie
The indicator continuously monitors price action relative to these zones, providing real-time breakout signals: "BreakUp" for bullish breakouts above resistance and "BreakDn" for bearish breakouts below support. Each block displays cumulative volume data, including total volume processed and the percentage of buying (bullish) versus selling (bearish) activity, helping traders assess market intention within these areas.
Pivot Breaker Block supports multiple trading strategies, including breakout entries and mean reversion, with configurable parameters such as pivot lookback period, zone height factors, and visual transparency. It is suitable for various markets including Forex, indices, commodities, stocks, and cryptocurrencies, and works effectively on timeframes from 15 minutes to daily charts.
Key features:
- Automatic pivot detection with adjustable lookback
- Dynamic supply and demand zone sizing based on ATR
- Real-time volume accumulation and buy/sell ratio visualization
- Breakout alerts with on-screen signals
- Supports multiple asset classes and timeframes for versatile use