
기능
드래그 가능한 이동평균은 이동평균을 가격 이력의 어느 지점에든 고정합니다 — 0번째 바에서 시작하지 않고, 고정된 기간을 기준으로 하지 않으며, 정확히 사용자가 지정한 위치에서 시작합니다.
표준 이동평균은 차트 데이터의 시작점부터 시작하여 시간이 지남에 따라 수렴합니다. 기간이 고정되어 있습니다. 시작 기준점은 임의적입니다. 특정 구조적 이벤트 — 조정 시작, 임펄스 시작, 주요 스윙 — 이후 가격이 어떻게 변했는지 측정하려 할 때, 이동평균을 그 순간에 고정할 방법이 없습니다.
이 지표가 그 문제를 해결합니다.
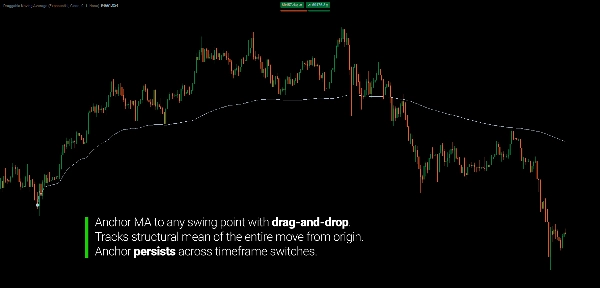
앵커 아이콘을 원하는 바에 놓으세요. 이동평균은 그 바에서 시작하여 앞으로 확장됩니다. 아이콘을 다른 바로 드래그하면 이동평균이 즉시 새 위치에서 재계산됩니다. 시간 프레임을 전환해도 앵커는 유지되며, 이동평균은 새 차트에서 자동으로 재계산됩니다.
결과는 사용자가 정의한 특정 구조적 지점에서 가격이 어떻게 변했는지를 항상 반영하는 이동평균입니다.
핵심 이점
표준 접근법:
- 조정 또는 임펄스 움직임의 시작을 식별
- 고정 기간 이동평균 적용 — 차트 시작부터 시작하며 구조적 시작점이 아님
- 기간을 수동으로 조정하여 구조 길이를 근사
- 시간 프레임 전환 — 기간이 다른 바 수에서는 의미 없어짐
- 구조가 변경될 때마다 반복
드래그 가능한 접근법:
- 구조 시작점에 앵커 배치
- 이동평균이 정확히 그 바에서부터 앞으로 계산
- 시간 프레임 전환 — 앵커 유지, 이동평균 자동 재계산
- 드래그로 조정 — 모든 것이 즉시 업데이트
차이점은 구조적입니다. 기간 조정을 통해 기준점을 근사하는 대신, 직접 정의합니다. 구조적 지점이 입력값이며 기간이 아닙니다.
구조에 고정: 평균회귀 및 반전 감지
이동평균이 구조적 스윙 지점 — 추세의 시작, 임펄스의 시작, 조정의 시작 — 에서 시작하면 임의의 평활선이 아니라 구조적 평균으로 작동하기 시작합니다.
가격은 그 평균을 중심으로 예측 가능한 방식으로 움직입니다:
- 움직임 중, 가격은 고정된 이동평균 주위에서 진동합니다 — 모멘텀 폭발 시 멀어지고, 조정 시 이동평균으로 돌아옵니다. 이동평균은 최근 바뿐 아니라 구조 전체의 평균 가격을 반영합니다.
- 소진 시, 가격은 고정된 이동평균을 튕겨내는 대신 교차하기 시작합니다. 상승하는 고정 이동평균 아래에서 마감하는 것은 구조적 의미가 있습니다. 전체 움직임의 평균이 위반되고 있습니다.
- 반전 후, 고정 이동평균은 저항이 됩니다. 아래에서 이동평균을 재시험하는 것은 이전 구조적 평균이 공급으로 작용하는 논리적 영역을 나타냅니다.
이 행동은 이동평균이 올바른 것을 측정하기 때문에 일관됩니다: 임의의 기간이 아니라 실제 시작점부터 특정 구조적 움직임의 평균 가격입니다.
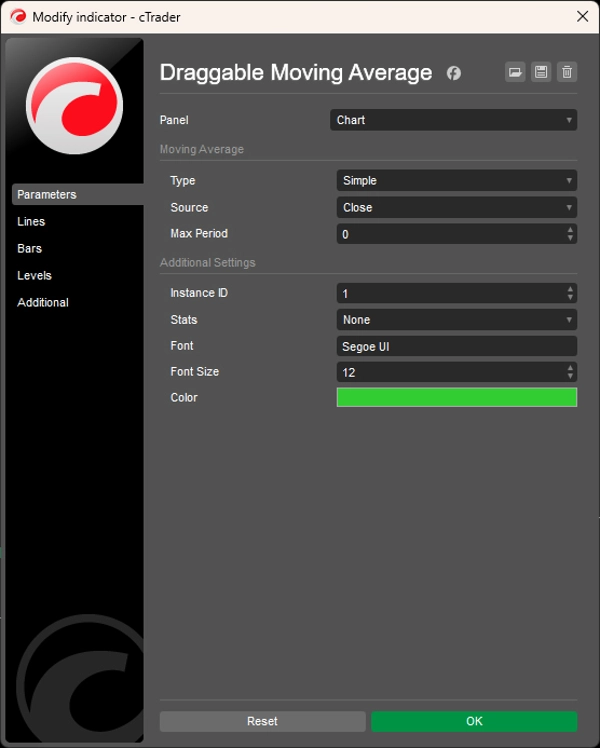
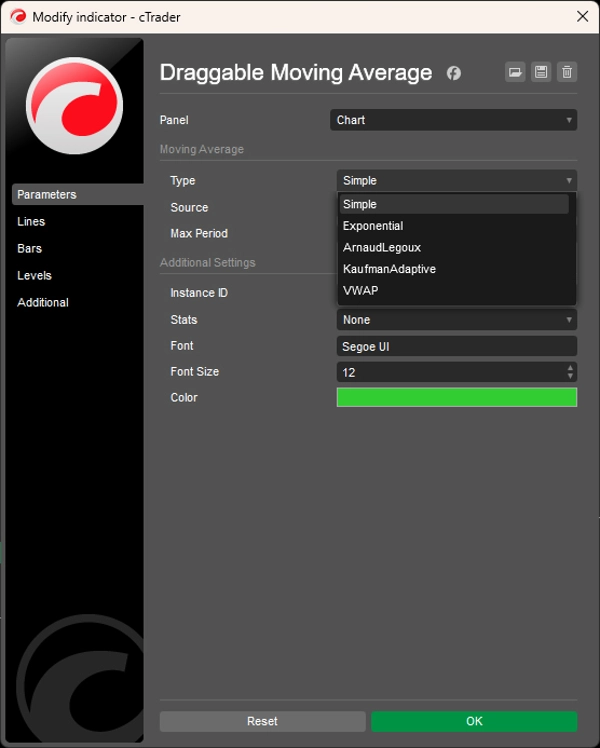
지원되는 이동평균 유형
인스턴스별로 선택 가능한 다섯 가지 계산 방법:
- 단순 (SMA) — 앵커부터 앞으로 산술 평균; 최대 기간에 도달할 때까지 각 바마다 증가
- 지수 (EMA) — 지수 가중치; 최근 가격 움직임에 더 민감
- 아르노 레구 (ALMA) — 가우시안 가중치; 지연을 줄이면서 노이즈 증폭 방지
- 카우프만 적응형 (KAMA) — 시장 효율성 비율에 따라 평활 조정; 추세 시 좁아지고 조정 시 넓어짐
- VWAP — 앵커부터 거래량 가중 평균; 구조적 지점 이후 대부분의 거래량 위치 반영
모든 유형은 최대 기간 매개변수를 준수합니다 — 앵커를 기준점으로 유지하면서 조회 기간을 제한합니다.
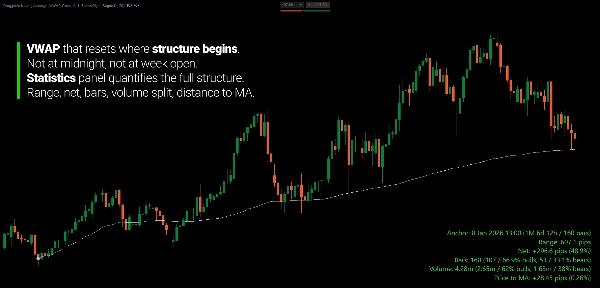
통계 패널
선택 가능한 네 모서리 위치의 오버레이 패널로, 앵커부터 현재 바까지 실시간 지표를 표시합니다:
- 범위 (최고가에서 최저가까지, 핍 단위)
- 순 변화량 (핍 및 백분율)
- 총 바 수와 상승/하락 바 수 및 백분율
- 총 거래량과 상승/하락 분할 및 백분율
- 현재 가격과 이동평균 간 거리 (핍 및 백분율)
- 앵커 바부터 현재 바까지 기간 및 바 수 카운터
앵커한 정확한 구조를 정량화하는 데 유용합니다 — 단순히 이동평균선뿐 아니라 시작점부터 현재까지 가격 움직임의 전체 통계 프로필을 제공합니다.
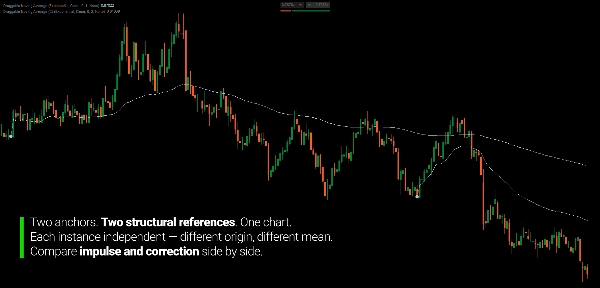
다중 인스턴스 지원
각 인스턴스는 고유한 인스턴스 ID를 가집니다. 여러 인스턴스를 동시에 실행할 수 있으며 — 하나는 조정 시작점에, 다른 하나는 이전 임펄스에 고정 — 아이콘이나 레이블 충돌 없이 사용할 수 있습니다.
주요 기능
- 드래그 가능한 앵커 아이콘 — 원하는 바에 놓고 드래그하여 조정, 이동평균 즉시 업데이트
- 다섯 가지 이동평균 유형 (SMA, EMA, ALMA, KAMA, VWAP)
- 여덟 가지 가격 소스 (시가, 고가, 저가, 종가, 평균, 중앙값, 전형값, 가중값)
- 앵커 기준 최대 기간 제한 및 롤링 윈도우
- 네 모서리 위치 선택 가능한 선택적 통계 패널
- 고유 인스턴스 ID를 가진 다중 인스턴스 지원
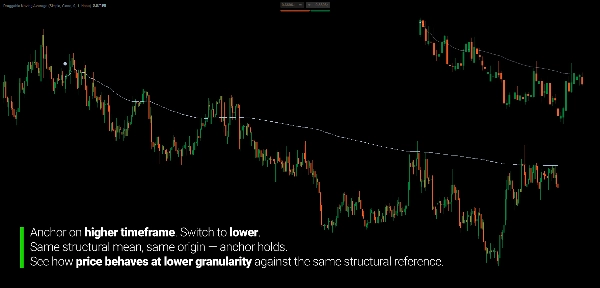
- 시간 프레임 전환 시에도 앵커 유지
대상 사용자
이 지표는 시간 프레임 전반에 걸쳐 시장 구조를 분석하는 트레이더를 위한 것입니다 — 특히 임의의 조회 기간이 아니라 정의된 구조적 기준점에서 가격 행동을 측정하려는 사용자에게 적합합니다.
상위 시간 프레임에서 조정 및 임펄스 구간을 분석하고, 하위 시간 프레임에서 동일 구조를 평가해야 할 경우, 드래그 가능한 앵커를 사용해 구조 시작점을 한 번 표시하고 시간 프레임 뷰 전반에 걸쳐 유지할 수 있습니다. 일간 차트에 앵커를 놓고 M15로 전환해도 기준점이 유지됩니다.
이 지표는 스윙 및 포지션 트레이더에게 적합하며, 고정 기간이 아니라 구조적 움직임을 중시하는, 다중 시간 프레임 분석가가 차트 간 일관된 기준점을 필요로 하며, 재량 트레이더가 기간 추측 없이 정확한 사용자 정의 이동평균 고정을 원할 때 적합합니다.
이것은 신호 시스템이 아닙니다. 가격 움직임을 이미 구조적으로 사고하는 트레이더가 이동평균이 그 움직임을 정확히 반영하도록 하기 위한 구조적 측정 도구입니다.
차별점
표준 이동평균은 기간 기반입니다. 기준은 암묵적이며 — 현재 바에서 n 바 이전입니다. 구조적 움직임이 끝나고 새 움직임이 시작되면 기간은 무의미해집니다. 표준 이동평균은 특정 이벤트를 가리킬 수 없습니다.
이 지표는 기준을 명시적으로 만듭니다. 구조적 이벤트에 앵커를 고정합니다. 이동평균은 거기서부터 측정합니다. 입력값은 기간이 아니라 구조적 지점입니다.
결과는 실제 구조 분석을 반영하는 이동평균입니다. 근사가 아닙니다.
---
이동평균을 구조적 평균으로 이해하기
이동평균은 지지 및 저항 수준으로 널리 오해받고 있습니다. 트레이더들은 가격이 50 이동평균을 "존중"하거나 200 이동평균에서 반등하기를 기다리며, 이 숫자들이 고유한 시장 의미를 가진다고 생각합니다. 그렇지 않습니다.
이동평균은 분포의 산술적 설명입니다 — 정의된 창에서의 평균 가격입니다. 그 선이 의미 있는지 여부는 공식이 아니라 측정되는 창이 구조적 관련성을 가지는지에 달려 있습니다.
이것이 기간 기반 이동평균이 근본적으로 제한적인 이유입니다. 50 기간 이동평균은 마지막 50 바를 측정합니다 — 어떤 구조적 이벤트와도 관계없는 창입니다. 추세가 시작된 지점이나 조정이 시작된 지점과 일치하지 않습니다. 단지 최근성에 의해 결정된 임의 길이의 롤링 창입니다.
구조적 스윙 지점에 앵커를 고정하면 이동평균은 그 시작점부터 앞으로의 특정하고 일관된 가격 분포의 평균이 됩니다. 가격이 그 위로 크게 벗어나면, 시작점에 진입한 참가자들이 확장된 상태입니다. 가격이 다시 그로 돌아오면 분포의 재조정을 반영합니다. 가격이 깨끗하게 돌파하면, 구조적 시작점의 평균 참가자가 손익분기점이거나 손실 상태임을 의미합니다 — 선이 깨진 것이 아니라 통계적 체제 변화입니다.
기하학이 원인이 아닙니다. 사용자가 정의한 구조적 분포의 경계에 대한 통계적 설명입니다.
---
트레이딩은 위험을 수반합니다. 이 지표는 기술적 분석 도구이며 — 항상 적절한 위험 관리를 적용하세요.


