present
가입하고 첫 구매 시 $50 할인을 받으세요
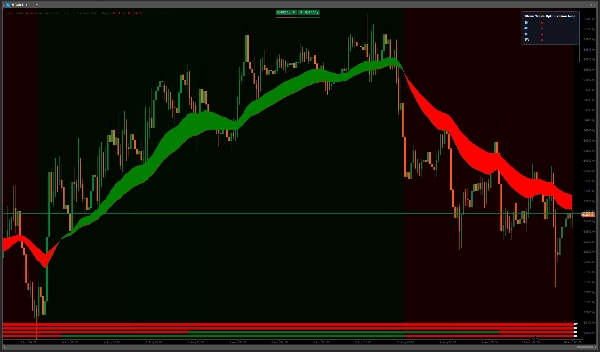
Trading product for Clean Trade Optimization Line Pro 지표 Supertrend, image 1
Clean Trade Optimization Line Pro
지표
버전 1.0, Aug 2026
Windows, Mac
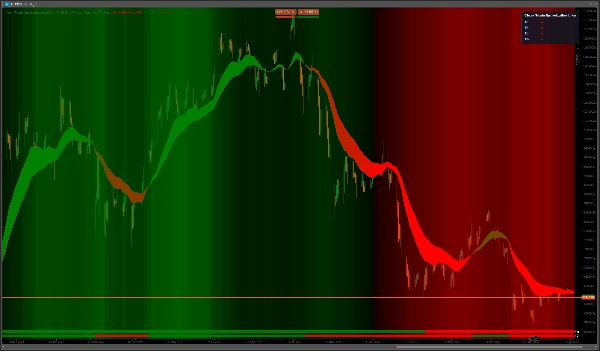
Trading product for Clean Trade Optimization Line Pro 지표 Supertrend, image 2
Trading product for Clean Trade Optimization Line Pro 지표 Supertrend, image 3
Trading product for Clean Trade Optimization Line Pro 지표 Supertrend, image 4
Trading product for Clean Trade Optimization Line Pro 지표 Supertrend, image 5
가입일 23/07/2026

설명

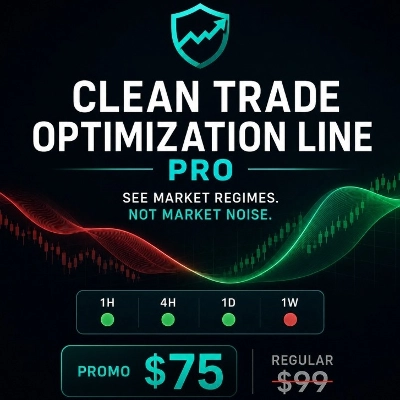
시장 소음이 아닌 시장 체제를 보세요.


Clean Trade Optimization Line Pro는 복잡한 가격 움직임을 집중을 위해 설계된 깔끔하고 고급스러운 시각적 경험으로 변환합니다.


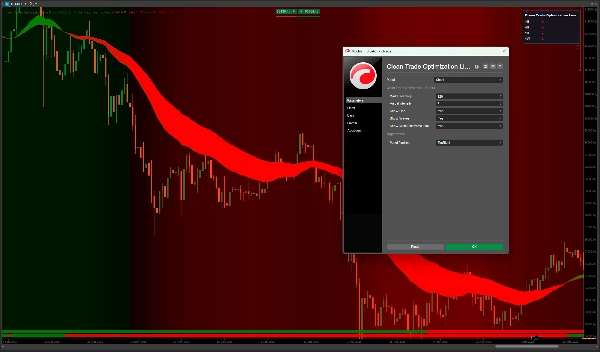
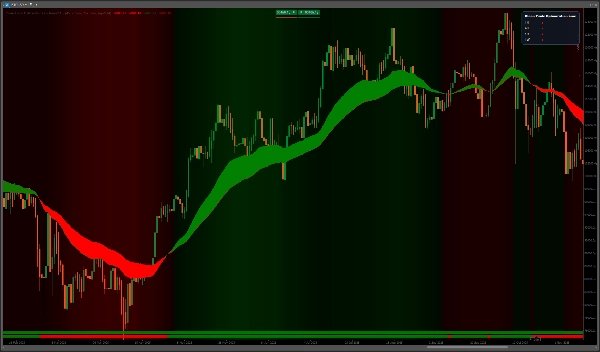
방향성 리본은 시장 성격 변화를 즉시 볼 수 있게 합니다. 부드러운 배경 파동은 혼란 없이 더 넓은 맥락을 추가하며, 다중 시간 프레임 뷰는 큰 그림을 가까이 유지합니다. 역사적 상태 바는 차트와 직접 정렬되어 시장 맥락이 가격과 함께 어떻게 진화했는지 볼 수 있도록 도와줍니다.


인터페이스는 의도적으로 단순하게 유지됩니다. Clean Trade Optimization Line Pro를 차트에 추가하고 원하는 시각적 강도를 선택한 후 중요한 것에 집중하세요.


Clean Trade Optimization Line Pro는 주요 시장 전환을 탁월한 명확성으로 볼 수 있는 1D 시간 프레임의 BTC와 훌륭하게 작동합니다.


하이라이트


• 고급 리본 시각화

• 부드러운 강세 및 약세 시장 맥락

• 다중 시간 프레임 상태 개요

• 차트 정렬된 역사적 맥락

• 깔끔하고 집중된 인터페이스

• 재도색 없는 역사적 표현

• cTrader 지표로 독점 설계


소음은 줄이고 맥락은 늘리고 집중은 더하세요.


Clean Trade Optimization Line Pro는 기술적 분석 지표일 뿐입니다. 미래 시장 성과를 예측하지 않으며 수익이나 거래 성공을 보장하지 않습니다.


신중하게 거래하세요. 위험을 관리하세요.

요약

AI 요약
Clean Trade Optimization Line Pro is a technical analysis indicator designed exclusively for the cTrader platform. It provides a premium visual representation of market regimes, focusing on clarity by filtering out market noise. The indicator features a directional ribbon that highlights changes in market character, smooth background waves to convey bullish and bearish context, and a multi-timeframe status overview to maintain awareness of broader market conditions. Historical status bars aligned with the price chart allow users to track how market context has evolved over time. Its interface is intentionally simple, enabling users to adjust visual intensity and focus on relevant market information. The indicator is optimized for use with Bitcoin (BTC) on the daily (1D) timeframe, where it helps identify major market transitions with enhanced clarity. It offers non-repainting historical data presentation to support reliable analysis. Key features include premium ribbon visualization, smooth market context waves, multi-timeframe overview, chart-aligned historical context, and a clean, focused interface. This product is categorized under trend indicators and supports visualization and signal outputs, including cross signals, based on bar data inputs.
지표 프로필
지표 카테고리
추세
출력 유형
신호
시각화
데이터 요구 사항
막대만
지원되는 신호
크로스

상담

고객 리뷰

0.0
리뷰: 0
고객 리뷰
이 상품에 대한 리뷰가 아직 없습니다. 이미 사용해 보셨나요? 다른 사람들에게 가장 먼저 소개해 주세요!

자주 묻는 질문(FAQ)

Supertrend
트레이딩 봇, 지표, 플러그인 등 cTrader Store에서 제공되는 상품은 제3자 개발자에 의해 제공되며, 이는 단순히 정보 및 기술적 접근을 목적으로 제공된 것입니다. cTrader Store는 중개인이 아니며, 투자 조언, 개인별 추천 또는 향후 성과에 대한 어떠한 보장도 제공하지 않습니다.

좋아하실 만한 다른 항목

지표
SMC
Forex
+7
Simple Smart Money Concepts (SMC)
지표
ATR
Wedge
+2
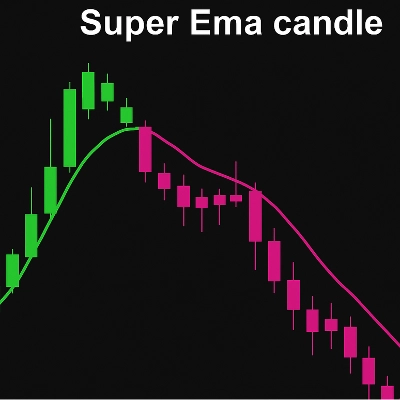
Strong Supertrend Turn Market Movement into a Clear Map Market analysis
지표
Forex
BTCUSD
+5
Simple ICT Concepts
지표
AI
Prop
+7
EMA Clouds, Multi-Timeframe (MTF) Overlay, Swing High/Low detection, and a smart Dashboard with neutral zone filtering.
지표
Forex
Crypto
+2
PREMIUN INDICATOR
지표
ATR
BOS
+5
Opening ranges, dynamic trend channels, and multi-scale breakout/retest analysis for clear intraday chart decisions.
지표
ATR
RSI
+1
Super Trend Rsi ,ATR + trend change distance + dynamic Alpha, divergence/convergence
지표
AI
ATR
+9
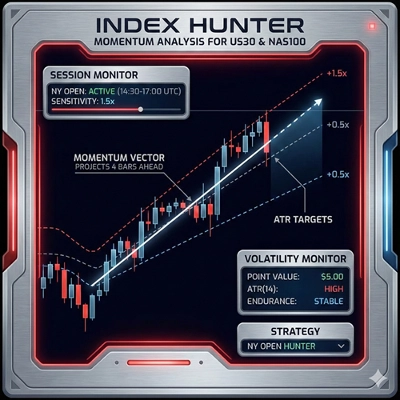
Index Hunter: Momentum analysis for US30 & NAS100. Designed to identify high-velocity moves and intraday trends.
지표
ADX
ATR
+5
Configure, simulate, and analyze trading strategies with custom filters, multi-target exits, and detailed performance me
지표
Prop
Forex
+4
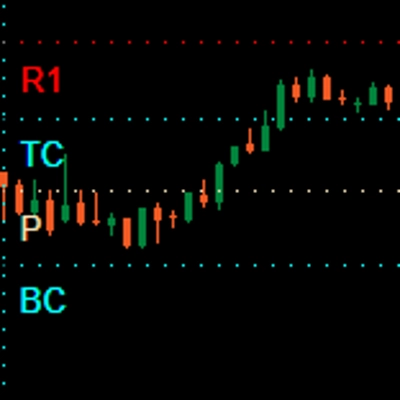
Draws pivots (P, S/R, CPR) from selected anchors like H1–Month1, with optional mid-levels (PS1, S1S2, etc.)
지표
RSI
SMC
+4
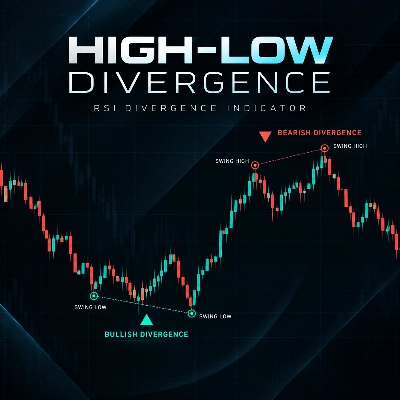
High Low Divergence is a clean, overlay indicator that automatically identifies swing highs and swing lows
지표
AI
ATR
+26
Liquidity Cluster Order automatically detects and draws accumulation zones & distribution zones
지표
Forex
BTCUSD
+4
This indicator is designed to perform multiple non-linear regression analysis using four independent variables.
지표
SMC
Forex
+5
ICT liquidity engine for Gold: maps stop clusters, scores zones & projects the next target. Now with 4 ICT killzones.
지표
RSI
RSI on the main chart with 45/55 momentum levels, overbought/oversold levels, averaged RSI, and multi-timeframe support.
지표
AI
Grid
+17
BORIS Easy Trend: Relax & scalp with 6-TF alignment. Clear BUY/SELL signals & movable UI/HUD make trading effortless.
지표
The Weekly Daily Levels indicator shows the OHLC, and mid-point prices for the previous day and week.
지표
AI
SMC
+5
Complete ICT Killzones: 5 sessions, easy colors, transparency controls & session info. Professional timing for cTrader.

가격

가입일 23/07/2026