
Descrizione
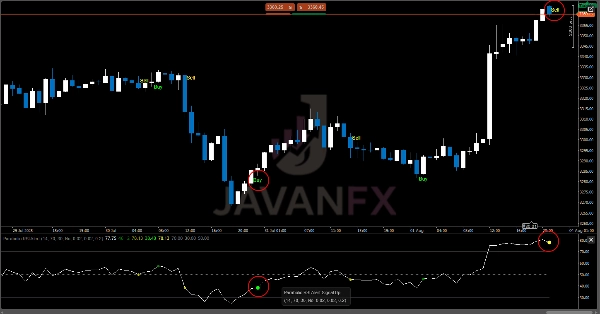
Il Parabolic RSI Alert è un indicatore potente che combina la precisione del Relative Strength Index (RSI) con le capacità dinamiche di trend-following di un Parabolic SAR personalizzato. Questa fusione unica aiuta i trader a identificare punti di inversione ad alta probabilità con segnali visivi chiari e avvisi in tempo reale.
Note d'uso:
- L'indicatore funziona meglio su timeframe da 1H in su
- Segnali forti si verificano quando le inversioni avvengono in zone di ipercomprato/ipervenduto
- Segnali regolari appaiono quando le inversioni avvengono fuori dalle zone estreme
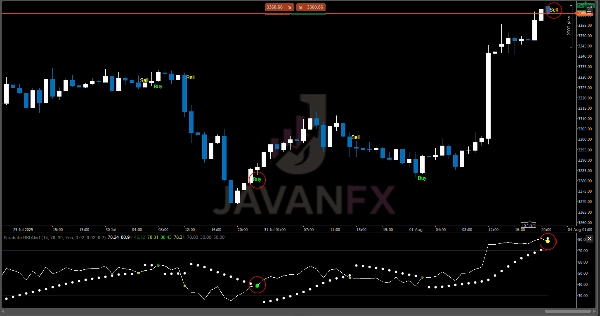
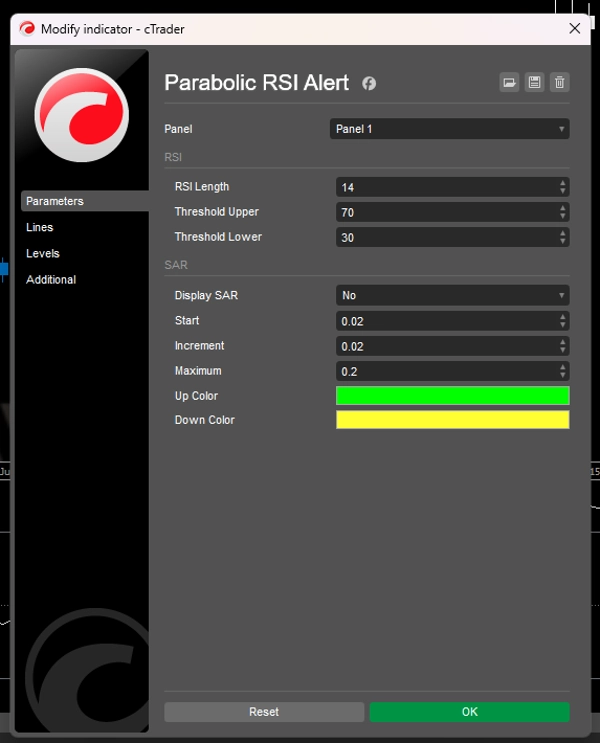
- I punti SAR vengono tracciati solo quando
Display SARè abilitato - Combinare con price action e altri indicatori per confermare i punti di entrata e uscita (opzionale).
Ideale per i trader che:
- Vogliono ridurre il ritardo nell'analisi tradizionale del RSI
- Hanno bisogno di avvisi visivi e sonori chiari per entrate tempestive
- Preferiscono segnali meccanici piuttosto che letture soggettive del grafico
Riepilogo
Profilo indicatore
Recensioni dei clienti
0.0
Recensioni: 0
Recensioni dei clienti
Questo prodotto non ha ancora ricevuto recensioni. L'hai già provato? Fallo sapere agli altri per primo!
Discussioni
Domande frequenti
I prodotti disponibili tramite cTrader Store, inclusi bot di trading, indicatori e plugin, sono forniti da sviluppatori terzi e resi disponibili esclusivamente a scopo informativo e di accesso tecnico. cTrader Store non è un broker e non fornisce consulenze in materia di investimento, raccomandazioni individualizzate o garanzie di risultati futuri.


Prezzo
Da 14/07/2025
60
Vendite